Abstract
This paper demonstrates the use of a user-centred design approach for the
development of generous interfaces/rich prospect browsers for an online cultural
heritage collection, determining its primary user groups and designing different
browsing tools to cater to their specific needs. We set out to solve a set of
problems faced by many online cultural heritage collections. These problems are
lack of accessibility, limited functionalities to explore the collection through
browsing, and risk of less known content being overlooked. The object of our
study is the Dutch Folktale Database, an online collection of tens of thousands
of folktales from the Netherlands. Although this collection was designed as a
research commodity for folktale experts, its primary user group consists of
casual users from the general public. We present the new interfaces we developed
to facilitate browsing and exploration of the collection by both folktale
experts and casual users. We focus on the user-centred design approach we
adopted to develop interfaces that would fit the users' needs and
preferences.
Introduction
Over the past few decades, an ever-growing amount of cultural heritage
collections has been digitised and made available online. In principle, the
materials in these collections are now available to larger audiences than ever
before. In practice, the accessibility of many online collections is limited by
the absence of easy, user-friendly ways to explore the collection and get an
overview of their contents [
Ruecker et al. 2011]
[
Whitelaw 2015]. This may result in users accessing only materials
they already know or expect to be in the collection, while unknown items remain
hidden. Finally, accessibility for the general public will be reduced if a
collection is presented mainly from an expert perspective [
Trant 2006].
Whitelaw proposes to improve accessibility of online collections by designing
so-called generous interfaces, “rich, browsable interfaces that reveal the
scale and complexity of digital heritage collections” by allowing the
whole content of a database to be accessed from a single starting point [
Whitelaw 2015]. This is a similar solution to the rich-prospect
browsers proposed by Ruecker et al., which show “a visual representation of every item in a given
collection, combined with tools for manipulating the display”
[
Ruecker et al. 2011].
In this paper we demonstrate the use of a user-centred design approach for the
development of generous interfaces/rich-prospect browsers for an online cultural
heritage collection, by determining its primary user groups and designing
different browsing tools to cater to their specific needs [
Stephenson 1999]. In doing so, we address the following problems
faced by many online cultural heritage collections:
- Lack of accessibility, in particular for casual users with no existing
knowledge of the collection.
- Limited functionalities to explore the collection through browsing.
By improving accessibility and offering rich browsing possibilities, we also
intend to reduce the risk of less-known content being overlooked.
The object of our study is the Dutch Folktale Database, an online collection of
tens of thousands of folktales from the Netherlands (
www.verhalenbank.nl). Although
this collection was designed as a research commodity for folktale experts, in
practice its primary user group consists of casual users: members of the general
public who access the collection infrequently and mostly for personal use.
Below, we start off by describing the content and use of the Dutch Folktale
Database. Then we present the new tools and interfaces we developed to
facilitate browsing and exploration of the collection by both folktale experts
and casual users. We focus on the user-centred design approach we adopted to
develop interfaces that would fit the casual users' needs and preferences.
About the Dutch Folktale Database
Folktales have been an important aspect of culture for as long as we can trace
back in history. Jokes, legends, fairy tales, etcetera have been conceived, told
and retold over time. For considerably less time, they have also been documented
in manuscripts, documents, books, and catalogues. In 1994 a database containing
folktales collected in The Netherlands was established at the Meertens Institute
in Amsterdam and was baptised the Dutch Folktale Database. It has been extended
with new folktales and subcollections ever since. The first version was a local
database, only available to researchers within the institute, but in 2004 the
database became available online. At the moment of writing the Dutch Folktale
Database contains roughly 44.200 folktales from all over the Netherlands, in
several languages (mostly Dutch and Frisian) as well as numerous dialects and
historical versions of Dutch. They have been collected by 1477 collectors and
cover almost a thousand years, with the oldest folktales dating back to the 12th
Century. The folktales have been annotated with an abundant amount of metadata
related to the story content such as summary, keywords, motifs and folktale
type, as well as metadata related to the storytelling situation such as
geolocation, narrator, collector, corpus, and source. These rich annotations
make the database very useful as a resource for research, on top of its evident
archival function.
The Dutch Folktale Database is a good illustration of the accessibility problems
of online cultural heritage collections sketched above. Its original search
options demanded a fair amount of knowledge about the contents of the
collection, and were not suitable for casual users. Stories of interest could
remain hidden if a specific search was not done correctly. Even though browsing
is a preferred information seeking method for people working with folktales [
La Barre and Tilley 2012], possibilities for browsing the collection were very
limited. At the same time, the size, variability and growth of content made it
difficult for its users to have an overview of the collection.
In the project FACT (Folktales As Classifiable Texts), which forms the context
for the work presented in this paper, methods for automatic folktale annotation
have been developed that are expected to further speed up the growth of the
database [
Nguyen et al. 2012]
[
Nguyen et al. 2013]
[
Trieschnigg et al. 2012]
[
Trieschnigg et al. 2013b]. In addition, the metadata of the folktales
already present in the database have been cleaned up and standardised [
Muiser et al. 2012], improving the possibilities to search, categorise
and compare them. Some faulty or missing data however, cannot be corrected or
retrieved. Folktales may have been narrated by an anonymous person, or annotated
without a date or location. This can make them difficult to access, as they may
be pushed to the back, or even left out, of search results. By providing users
with the opportunity to browse and explore the collection from many different
angles, we hope to enable more “accidental” discovery of also
these hidden gems.
Use of the Dutch Folktale Database
One of the basic principles of user-centred design is to start by understanding
the users [
Gould and Lewis 1985]
[
Stephenson 1999]
[
Preece et al. 2015]. Therefore, before deciding on the direction to take
for the development of new interfaces for the Dutch Folktale Database, an
analysis of how it is being used and who is using it was necessary.
As a first step, we conducted a short poll among the website visitors of the
Dutch Folktale Database, asking them for which purpose they wanted to use the
information from the database. The seven answer options can be seen in Table 1.
The poll was similar to a survey on an earlier version of the website [
Trieschnigg et al. 2013a], except that we added one answer option
(“For a school assignment”) because this purpose was
often entered in the “other” field of the earlier survey. In
our poll, users could choose only one answer whereas in the survey of
Trieschnigg et al., more than one answer could be selected.
The poll ran for around 3 weeks in the spring of 2015 and was filled in by 226
users of the Dutch Folktale Database. In Table 1 we can see that most people
visited the website for personal use (73.5%). This number has increased since
the earlier poll, of which the results are also shown in Table 1 for comparison.
A possible explanation is that since the beginning of 2013, the Dutch Folktale
Database uses a new content management system called Omeka (
http://omeka.org/). Omeka makes the website
rank higher in the results of search engines, thereby likely attracting more
casual visitors.
| Use of the Dutch Folktale Database |
2015
(n=226, single choice per user) |
2012/2013 [Trieschnigg et al. 2013a]
(n=88, multiple choices per user) |
| Personal use |
166 (73.5%) |
56 (63.3%) |
| School assignment |
16 (7.1%) |
- |
| Storytelling |
14 (6.2%) |
26 (29.5%) |
| Education |
9 (4.0%) |
12 (13.6%) |
| Other |
9 (4.0%) |
11 (12.5%) |
| Scholarly use |
8 (3.5%) |
15 (17.0%) |
| Journalism |
4 (1.8%) |
3 (3.4%) |
Table 1.
Responses of visitors of the Dutch Folktale Database website to the
question “What do you want to use the information from the Folktale
Database for?”
To get more information on who the users are, where they come from and how they
use the Dutch Folktale Database, we used Google Analytics (
https://analytics.google.com/)
to collect visitor data between Feb-June 2015. Google Analytics is a platform
that provides a large amount of statistics about websites. It allows for a
detailed analysis of the behaviour of the users, including click-through paths.
We found that during the investigated period, the Dutch Folktale Database
received about 350-400 individual users per day, in about 400-450 sessions. They
were quite evenly distributed over five age groups (18-24, 25-34, 35-44, 45-54,
55-64, 65+) with percentages between 15% and 20%. Almost nine out of ten
visitors (88%) had never visited the website before. The remaining 12% were
“tagged” by Google Analytics as a returning visitor,
meaning a visitor who started a new session after having closed all pages of the
website. Whether users return can give us an indication of whether the user
experience on a site is adequate. The amount of time a user spends on the site
is also an indicator [
Khoo et al. 2008]. We found that the average
session duration was only 1:20 minutes, which seems rather short and suggests
that there was insufficient incentive for users to remain on the site and
explore further. Users visited an average of 2.03 pages per session. This is an
important metric, as it indicates how willing users were to explore more
folktales. The low number may have been due to the lack of an easy way for users
to explore the collection.
About 80% of the visitors arrived at the Dutch Folktale Database through a
general web search engine (e.g., Google). This would usually lead them directly
to the full text of a folktale. Therefore, one explanation for the short time
users spent on the site may be that many users immediately found what they were
looking for. However, we would like to tempt these users to explore other
folktales as well.
Only 11% of all visitors came to the website by entering the URL directly into
their browsers; the remaining 9% arrived through portals such as pagina.nl and
the main website of the Meertens Institute. The group who entered the URL
directly is likely to consist of experts on folktale research or other
professional users, as those familiar with the website are likely to know its
URL and use this as their entry point. These results are in line with the
findings from our 2015 poll, in which only 15.5% of the visitors indicated that
they used the database for professional purposes (storytelling, education,
scholarly use, journalism). Of these user groups, the storytellers and scholars
(9.8%) are most likely to make relatively frequent use of the Folktale
Database.
Summarizing, the results from our survey and Google Analytics show that although
one of the main purposes of the Dutch Folktale Database is to support humanities
research, the largest user group consists of people who stumble upon the
database through search engines, and for whom this is their first visit. These
casual users are an important target group of the Dutch Folktale Database, as we
aim to optimise its social impact and its utility for general audiences.
Unfortunately, the analysis revealed that on average the users did not stay long
on the website and did not visit many pages. This may have been caused by the
original lack of browsing facilities for the Dutch Folktale Database, which we
discuss next.
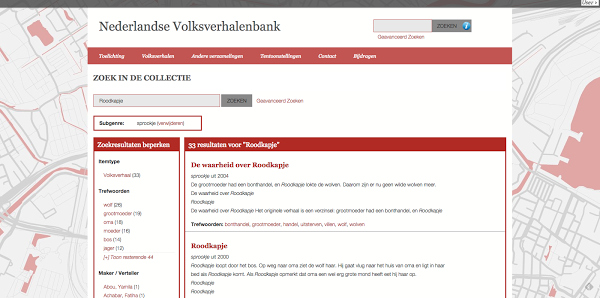
Accessing the Dutch Folktale Database
At the time of the analyses reported in the previous section, the possibilities
for searching and browsing the Dutch Folktale Database were limited to using a
simple Google-style search box located in the top right corner of each page, or
browsing through an alphabetical list of lexicon entries linked to stories.
After entering a search word or phrase in the search box, the user was provided
with a list of search results. There were no options for filtering the results;
the list could only be changed by changing the search phrase or by using the
“advanced search” option, which confronts the user with a
large list of search fields corresponding to folktale metadata, see Figure 1.
However, as we will discuss in more detail below, most of these advanced search
fields are only meaningful or relevant for folktale experts, not for casual
users. Moreover, the desired values needed to be typed manually into these
search fields, meaning the users needed to know their possible values to
successfully use them in a search.
To get more insight into what the users were looking for in the collection,
Trieschnigg et al. analysed the search queries made between April 2010 and Jan
2012 [
Trieschnigg et al. 2013a]. They found that among the most frequent
searches in both the simple and the advanced search interfaces were queries for
particular folktale subgenres, e.g., traditional legend or urban legend. The
fifth most frequent query in the simple search box was the empty query. This
indicates that many visitors do not have a specific information need, but simply
want to browse the collection. Unfortunately, these attempts at browsing by
means of an empty query would not yield any results at all.
These findings by Trieschnigg et al. suggest that both casual and expert users
would be served well by offering them the possibility to browse through
collections of items of a certain type in addition to searching directly for
specific items. However, experts and casual users may prefer different browsing
methods. For example, expert users have been found to like more complex
graph-based search approaches, whereas casual users prefer simple search methods
such as a controlled natural language approach, which experts find too
restrictive [
Elbedweihy et al. 2012].
An approach that seems suitable for meeting the information needs and search
preferences of both casual and advanced users is faceted search [
English 2002]. This approach uses the metadata of a collection to
visualise the search space and allows the users to refine, change or expand
their searches based on selections of these metadata. We applied different
variations of this approach in a number of visualisation tools and browsing
interfaces for both scholarly and casual users, as described in the following
sections.
Visualisation Tools for Folktale Researchers
In this section we present two visualisation tools we developed to support
experts (i.e., folktale researchers) in their exploration of the Dutch Folktale
Database and to help them discover new connections between folktales, based on
the metadata in the collection. The tools we developed provide dynamic
visualisations such as plotting search results on a map, timeline or network
graph. Such visualisations could lead to new insights into existing data and
could be used to verify assumptions that have been based on qualitative
research. By making these tools available to folktale researchers we aim to
inspire alternative ways of investigation that do not rely on prior familiarity
with the database, but support overview and exploration instead.
Two dimensions of folktales, geographic location and date, were obvious choices
for visualisation. These dimensions are of interest to researchers because of
their relationship with the historical and geographical environment in which the
tales came into existence [
Abello et al. 2012]. Both location and date
can be used to provide a bird’s eye view of the collection, or a subset of the
collection. Another dimension that is of interest to folktale researchers is the
connection between folktales [
Tehrani 2013]. These connections are
loosely defined, because they can be based on many different aspects of the
folktales and their metadata.
All visualisation tools we describe below have been developed using existing web
technologies such as the Solr search engine (
http://lucene.apache.org/solr/), the web scripting languages PHP(
http://www.php.net/) and javascript (
https://developer.mozilla.org/en-US/docs/Web/JavaScript) and D3.js
(
https://d3js.org/), a JavaScript
library for manipulating documents based on data that offers powerful
visualization components. The use of these technologies makes it possible for
the tools to be accessed via a web browser. This way it is not necessary for
users to install any software or download data.
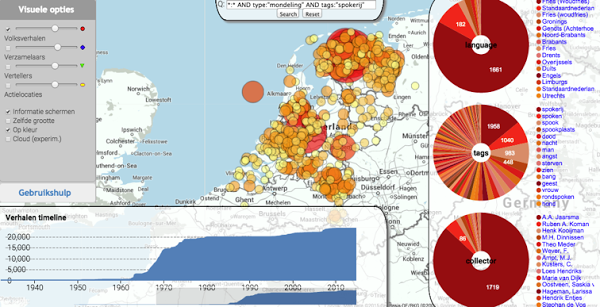
Map Tool for Folktale Researchers
The map tool supports selecting subsets of folktale data based on search
queries. It visualises the folktales on a map in combination with a timeline
(see Figure 2). This dynamic visualisation utilises a faceted navigation
technique [
English 2002], which can be used to obtain subsets
of folktales meeting specific selection criteria and narrow down on
folktales of interest. The facets are shown as pie charts on the right side
of the interface (see Figure 2) and can be clicked to update the results on
the map. The facets are updated as well to show the contents of the subset.
The visualisation starts with a full dataset overview from which cross
sections can be made. At the moment, the tool only visualises the locations
where the folktales were narrated and not, for example, the locations
mentioned in the folktales. Still, the completeness of overview of the
collection and therefore the accessibility of all corners of the collection
is apparent.
The interface relies on shapes and colours to represent several properties of
the data. A circle on the map represents a location where at least one
folktale was narrated. The size of a circle represents the number of tales
in a location. Transparency can be set for the circles to create an effect
similar to a heat map, which can give a clear picture of the concentration
of folktales in certain areas. To make individual circles more noticeable,
they can all be made the same size. This way, small circles will not be
hidden behind large ones. Folktales that have not been annotated with a
location are currently shown in the North Sea; this is a temporary solution
to keep them from being overlooked.
Geographical mapping as a principle can serve as a starting point for
international cooperation between folklore researchers by linking their
national collections, as advocated by Meder [
Meder 2010]. Due
to various factors such as ownership, differences in metadata and opinions
about content, it is very hard to establish a single international database
of folktales. It seems more feasible to let folktale databases exist in
their own context, and promote the “donation” of content
to a central system. A logical assumption that can be made about folktales
is that, with the exception of Internet based tales, they were recorded at a
certain time and place. This means that all folktale collections are
expected to contain at least time and place as metadata, which makes a
map-based interface very suitable as a collective interface.
Network Tool for Folktale Researchers
Similarity between folktales is of great interest to researchers who are
searching for the origins, kinship, variability and stability of tales [
Tehrani 2013]. However, most empirical investigations of
narrative similarity have only been carried out on a small scale so far [
Nguyen et al. 2014]. In our visualisation tool, the similarity of
large numbers of folktales can be determined based on different
configurations of metadata such as folktale type, keywords, named entities,
word count, genre, etcetera. This comparison yields a score that can be used
to determine their degree of similarity. In line with Abello et al., our
system visualises the similarity between tales as a dynamic network graph
(see Figure 3) [
Abello et al. 2012].
The tool can be used from different starting points. A single folktale can be
loaded to which neighbours, folktales with similar metadata, can be added.
These neighbours can subsequently be interconnected and added upon as well.
This way, an entire network can be built up from a single item. Another
starting point is to do a keyword search to obtain multiple folktales as
nodes. These can then be interconnected and added upon as well.
Once a network has been built, it is possible to start exploring grouped
nodes and links by clicking on them. There is also a possibility to select
multiple nodes to show the composition of this subset, using the same pie
chart shaped facets as are available in the map tool. By doing so, the user
is invited to find new perspectives to compare folktale stories. The tool
gives the user the freedom to hypothesise and test which metadata fields are
valuable to compare in order to gain new insights into the relations between
folktales, and how these relations evolved over place and time. It could be
used to verify existing theories and classifications that have been based on
qualitative research. For instance, when connecting folktale nodes purely
based on keywords, we found that clusters are formed that show good overlap
with the frequently used Aarne-Thompson-Uther (ATU) folktale type-index [
Uther 2004]. In other tests with the network tool, users have
already reported finding unexpected connections between tales. This is
because the tool connects texts outside traditional classification systems
that experts commonly use, such as ATU. These early findings suggest that in
the future, the tool may open up new avenues for folktale research that go
beyond what was previously possible.
A simplified network visualisation has been developed based on the network
software. It is included on each folktale page on the Dutch Folktale
Database website, see Figure 4. Around the folktale of interest a
“flower” of similar documents appears when such
documents are available. Users can inspect these similar documents by
clicking on them. We believe that both experts and casual users will
appreciate this addition, as Elbedweihy et al. found that both groups like
their search results to be augmented with related information [
Elbedweihy et al. 2012].
Both the expert Map tool and the expert Network tool are still under
development. We expect their current interfaces to be somewhat hard to
understand, because the focus thus far has not been on user friendliness but
on functionality. Thorough user evaluations with expert users still need to
be carried out to investigate the usability of both interfaces, similar to
what was done with the interfaces we designed for casual users, as discussed
in the next sections.
Search and Exploration Interfaces for Casual Users
Folktale researchers only form a fraction of the users of the Dutch Folktale
Database. As shown by our user polls, the large majority of its visitors are
interested in the collection for personal use. To accommodate this user group,
we adopted a user-centred approach to design two search and browsing interfaces
for casual users. We built these interfaces using the same software as used for
the expert visualisation tools discussed in the previous sections, but in their
design we focused on simplicity and usability. Unlike folktale researchers, who
are strongly motivated to use the collection and are less likely to be
discouraged by usability problems, casual users will quickly abandon the site if
their experience with it is not good. Our analysis of the use of the Dutch
Folktale Database made it clear that visitors need to be encouraged to spend
more time on the site, discover more content and come back for more.
Faceted Search Interface for Casual Users
The main access point to the Dutch Folktale Database used to be a simple
search box. As noted by Whitelaw, the trouble with this is that it requires
a query from the user, even though many users are not seeking specific
information [
Whitelaw 2015]. Our goal was therefore to design
a new search interface that would allow the users to make use of metadata to
search the collection, like in the advanced search (see Figure 1), but with
an easy-to-use faceted search interface instead of a list of search fields.
Such an interface should provide the users with a good overview of the
collection and of the different dimensions it can be searched or browsed on.
We expected this type of interaction with the collection to be intuitive, as
most users will already be familiar with faceted search interfaces from
popular web shops such as Amazon.
Our first step was to investigate which of the folktales’ metadata were of
interest to casual users, as opposed to domain experts. To this end we
recruited a test group of 9 potential users and presented them with a list
of metadata that could potentially serve as facets. We asked the
participants to indicate for each potential facet whether they would want it
to be included in the search interface. The ages of the participants (4
male, 5 female) ranged from 21 to 78 years, with an average age of 43 years.
This resembles the age distribution of the visitors of the Dutch Folktale
Database. Of the participants, two were scouting leaders and one was a
teacher on a primary school; these are the kinds of casual users that would
occasionally visit the Dutch Folktale Database looking for stories to tell
by the campfire or at school. None of the participants were familiar with
the Dutch Folktale Database.
The list of facets a majority of the users showed interest in is shown in
Table 2. Examples of potential facets that did not make the selection are
“motif”, a term from folktale research that was not
familiar to the participants, and “literary”, a field
with a yes or no value indicating whether a collection item was a literary
text or not.
| Facet (example value) |
Percentage of votes |
| keywords (wolf, grandmother) |
100% |
| subgenre (fairytale) |
89% |
| language (standard Dutch) |
89% |
| source type (book) |
89% |
| creator/teller (G. de Boer) |
89% |
| title (Little Red Riding Hood) |
78% |
| date (1971-09-28) |
67% |
| source (oral) |
67% |
| place of telling (Rotterdam) |
56% |
| collector (C. Bakker) |
56% |
Table 2.
Metadata selected as search facets by a majority of participants
(n=9).
The next step was the design of the search interface. We created several
alternative designs and presented them to six of the participants who had
judged the potential facets. In our design choices we mainly focused on
various options to present the facets, e.g., listing selected facets next to
each other or below each other; showing selected facets together with
non-selected facets, or in a separate section; showing all possible values
of each facet or only the most frequent ones, etcetera. Based on the users’
preferences, we created the final design shown in Figure 5. Selected facets
are shown below the main search box, but also among the non-selected facets
in the menu on the left. The list of shown values for each facet is limited
to a maximum of the eight most frequent ones, but users can fold open the
list for more values. After each value, the number of matching items in the
current result list is shown. When no search terms have been entered and no
facets have been selected, the numbers for all items in the database are
shown, giving the user an overview of the entire collection. The new search
interface was implemented using an Omeka plugin called SolrSearch, which
implements SOLR to become the primary search engine on Omeka-based sites.
SolrSearch was made by researchers of the ScholarsLab of the University of
Virginia (
https://github.com/scholarslab/SolrSearch).
We tested the usability of the new search interface using a Dutch translation
of the Standard Usability Test (SUS) [
Brooke 1996]. In this
test, participants indicate their level of agreement with ten statements on
a Likert scale ranging from 1 to 5. Example statements include, “I found
the system unnecessarily complex” and “I thought the system was
easy to use”. The new design was tested by nine participants
recruited from a public library. We expected library visitors to be more
likely than the average person to have an interest in folktales, and thus to
more be representative of our target group of causal users. To compare the
usability of the new search interface with that of the old version, we also
tested the old search interface. The test of the old version involved a
total of 14 participants: five library visitors, eight bachelor students
from our university (study programme: Creative Technology), and one actual
visitor of the Dutch Folktale Database who reacted to a call for
participants on the website. None of the participants had used either of the
tested interfaces before.
Participants were given a brief introduction to the Dutch Folktale Database,
and were then asked to do a search using an initial query of their own
choice. They were encouraged to explore the results page at their leisure,
after which they filled in the SUS questionnaire.
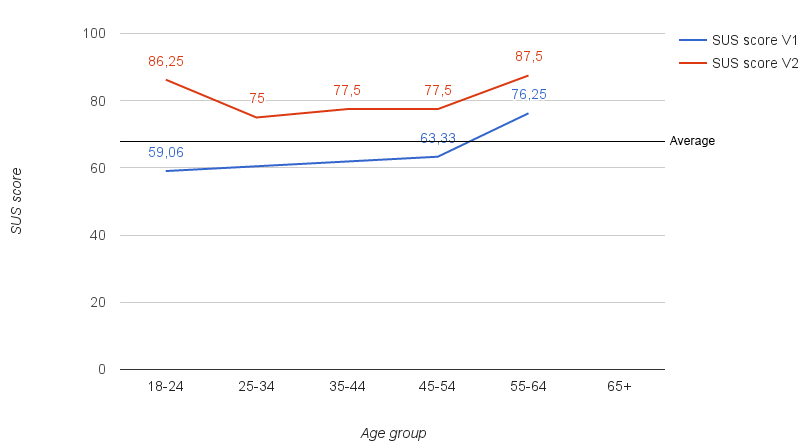
The results of the SUS test are calculated as described by Brooke [
Brooke 1996]. A total SUS score of 68 (out of 100) is seen as
average. In our test, the old search interface received a SUS score of
60.89, which is below average (Figure 6: SUS score V1). The new faceted
design received a SUS score of 81.39, which is well above average (Figure 6:
SUS score V2). We can conclude that the new design is a marked improvement
over the old search interface. However, a few critical remarks are in order.
First, those who tested the new search interface were more evenly
distributed in age than those testing the old version, which did not include
the age groups 25-34 and 35-44. Second, the students who tested the old
search interface might have been more critical of it due to their academic
background, and less interested in the contents of the Folktale Database.
This may have resulted in a lower SUS score for the old search interface
than would have been given by users who were more representative of the
target group. Still, Figure 6 shows similar trend lines for both interfaces,
so we feel it is safe to say that the overall usability of the new search
interface is higher than that of the old version.
Map-based Interface for Casual Users
In a short poll on the website of the Dutch Folktale Database (Spring 2015),
152 out of 240 respondents (63%) said they would like to make use of an
interactive map in the future. Therefore we created a second interface,
based on the map tool for folktale researchers that was described earlier in
this paper. We used the same technology as in the expert map tool, but
designed a new interface more suitable for casual users.
Given the complexity and size of the data that can be portrayed with maps,
especially interactive ones, there is a strong need for simplicity in design
so that the interface remains clear and overseeable for users [
Harrower and Fabrikant 2008]
[
Jones et al. 2009]. We established the following requirements for
the map-based user interface, based on the user interface guidelines
specified by Brown [
Brown 1999]:
- Minimalism: avoiding unnecessary elements so that the
interface is easy to grasp and the content is emphasised.
- Intuitiveness: the interface should feel natural and take
minimal effort to learn.
- Exploration: the design should encourage exploration of
both the stories in the database and of the interface itself.
- Simplicity: it should take the users a minimal amount of
time and steps to find the stories they are interested in.
- Appeal: the interface should be visually appealing,
encouraging users to use it and explore it further.
These requirements can be contradicting; for instance, a minimalistic
interface might emphasise the database content well, but could come at the
cost of being unintuitive. It is hence very important to find the right
balance between the requirements. For this reason, we carried out numerous
informal user tests with different interface designs.
The main concept was to provide a map showing folktales in the form of
bubbles (similar to the map tool for folktale researchers) and only a few
minimal “filter buttons” corresponding to facets that can
be used to select subsets from the collection. Figure 7 shows the initial
design of the filter buttons. After clicking a filter button, the values of
the facet are folded out for selection or deselection by the user. The
folktales matching the user’s selection are shown on the map. This way, the
users get to see only the stories they are interested in, while still being
invited to explore the other folktales in the database.
We included the following filters: folktale subgenre (e.g., legends, jokes),
source type (e.g., book, Internet), language/dialects (e.g., standard Dutch,
Frisian), keywords (e.g., death, man), and tale collectors. We selected this
last category instead of creators/tellers, because users looked more often
for collectors than creators in the transaction logs analysed by [
Trieschnigg et al. 2013a]. We made a conscious choice to strongly
limit the number of facets, preferring minimalism and simplicity of the
interface over completeness.
Based on informal feedback of several potential users on our initial design
ideas, we created a first mock-up of the interface (Figures 7 and 8) with a
few interaction possibilities, but no actual functionality. In a small-scale
user test, four people (age range 20-50, two male, two female) solved a few
simple tasks with the mock-up. This test showed that some of the icons we
used for the buttons were unclear. However, the biggest problem with the
interface design turned out to be the visualisation of multiple folktales at
the same location on the map. In the mock-up we used a bookmark metaphor for
this, using tabs to indicate multiple folktales per location (Figure 8). The
test showed that users did not notice these tabs very quickly, and when they
did, it was not clear to them that the tabs correlated with multiple
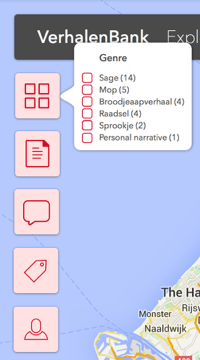
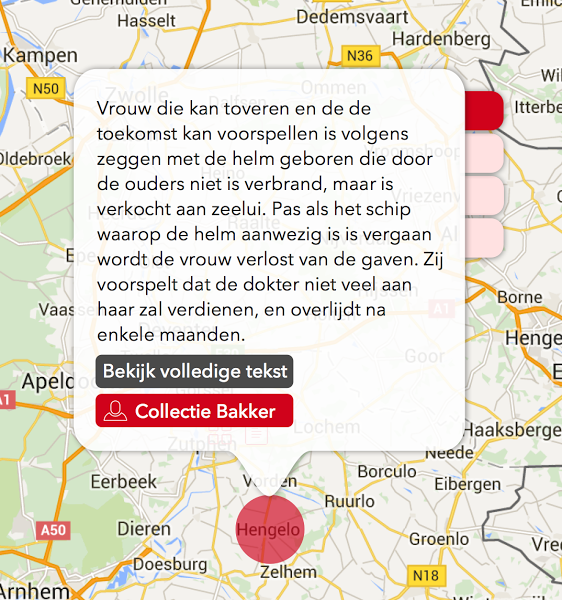
folktales. In our final interface design, shown in Figure 9, we therefore
used a fundamentally different solution, indicated by (4) in the figure. The
folktales are now shown as individual bubbles, placed in a circle around
their location. The subgenre of each folktale is indicated by an icon within
its bubble. The same icons are also used in the fold-out menu of the
subgenre filter button. This provides users with an instant indication of
the kinds of stories that are available per location. If the number of
folktales per location exceeds the number that can be presented in the
circle, a “More” button is included in the circle. When
clicked, it shows the next set of folktales at that location. This new
circle includes a back button to return to the previous set, and another
“More” button if even more folktales are
available.
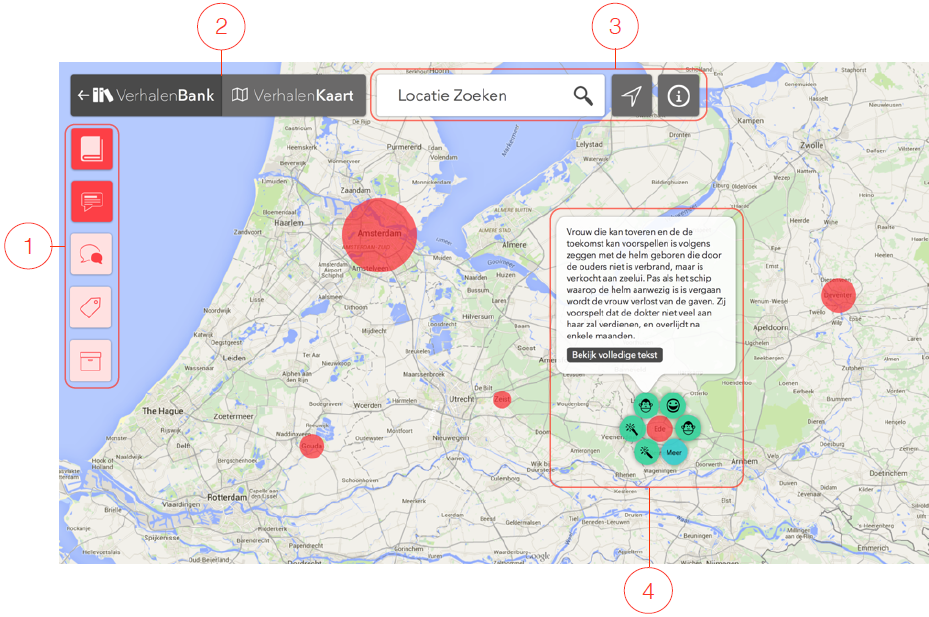
In the final design we changed the icons of most filter button icons to show
a clearer link with the depicted facet; see (1) in Figure 9. At the top left
of the interface (2) we added a switch between the map interface (Verhalenkaart in Dutch) and the regular
interface of the Dutch Folktale Database (Verhalenbank). Since we expected users to have an interest in
folktales at specific locations, e.g., local legends, a location search
feature was included. This allows users to instantly go to a specific place
on the map by typing in a location. We also included a “Locate
me” button for directly zooming in on the user’s current
location to show folktales in their vicinity (3). Finally, we customised the
map, using a muted colour scheme to avoid distracting the users, and showing
only those details which are important for finding folktales (e.g.,
including town names but leaving out the names of highways).
To determine the usability of the final design, we created a prototype with
limited functionality for a final evaluation experiment. The prototype did
not have access to the actual folktale database, but contained all essential
elements needed to test the interface and its functionality. The evaluation
was carried out with 22 participants, 19 of whom carried out the test
online. The remaining three interacted with the prototype in the presence of
an observer. Participants varied in terms of their gender (59% male, 41%
female), work or study (ranging from healthcare to ICT), and age (between 17
and 50 years, with an average age of 24). Most had received higher
education. Only one of them had used the Dutch Folktale Database before.
Participants were given three tasks that explored all the major elements and
core functionality of the map-based interface, including using multiple
filter options and navigating between several folktales at a single
location. After performing the tasks they were asked to fill in the
Usefulness, Satisfaction, and Ease of use (USE) questionnaire [
Lund 2001], which requires the users to indicate their level
of agreement with a number of statements concerning ease of use, ease of
learning and satisfaction on 7-point Likert scale. We also included a few
interface-specific statements on the effectiveness of the filter options and
the navigation between multiple folktales. Finally, we asked them to provide
feedback on the interface. The average results of the questionnaire are
given in Table 3. The participants were positive on all USE dimensions as
well as on the interface-specific statements.
| USE questionnaire |
Avg. Agreement |
St. Dev. |
| Ease of Use (11 statements) |
5.6 |
1.3 |
| Ease of Learning (4 statements) |
5.9 |
1.2 |
| Satisfaction (7 statements) |
5.3 |
1.4 |
| Additional statements |
|
|
| I can easily use the filters. |
5.9 |
0.7 |
| I understood what the filter buttons were for. |
6.0 |
1.0 |
| It was easy to navigate between multiple stories per
location. |
5.8 |
1.3 |
Table 3.
Evaluation results for the map-based interface prototype. Agreement
was rated between 1 (strongly disagree) and 7 (strongly agree).
The participants commented that the interface was user-friendly, clear, easy
to learn and tranquil. Negative comments mostly pertained to limitations of
the interactive mock-up. Other comments included suggestions such as adding
hover tooltips and adding extra animations to provide feedback. The three
participants we observed while they interacted with the prototype quickly
started using the filter buttons, understanding their purpose within a few
seconds. No navigation problems were observed; the participants seemed to
grasp the concept of multiple folktales around a location quickly and
well.
The results indicate that we succeeded in designing an interface for casual
users that is minimalistic, simple, appealing and intuitive. To which extent
the interface encourages exploration could not be tested given the limited
functionality of the prototype. Investigating this requires a longer-term
study using the fully functional interface, which has only recently been
integrated with the Dutch Folktale Database.
Conclusions and Future Work
In this paper we have described our methodology for designing 'generous
interfaces' [
Whitelaw 2015] and rich-prospect browsers [
Ruecker et al. 2011] for an online collection of folktales, serving two
main types of users with different knowledge and different information needs:
(1) researchers (expert users), who are interested in patterns and relations
between folktales, and who generally have a good understanding of what they are
looking for, and (2) casual users who, without browsing possibilities mostly
tend to search on genres or well-known fairy tales; see [
Trieschnigg et al. 2013a].
In our design process for casual users we followed a user-centred design
methodology, of which the main steps can be summarized as follows. The first
step was to employ web analytics and surveys to find out who used the
collection, how they used it and why. This helped us to obtain insights into the
different user groups. Next, the most relevant dimensions for searching and
browsing the collection were determined in consultation with representatives of
the main user groups. We carried out usability tests of candidate designs using
paper prototypes and mock-ups. Based on the results, the final interface designs
were established, technically implemented and integrated in the website of our
folktale collection
A similar methodology could be applied to other projects aimed at developing user
interfaces for digital cultural heritage collections, and we hope our case study
can serve as an inspirational example. We believe that taking a user-centred
approach is essential for the design of interfaces that are truly
“generous” and accessible for different kinds of users.
This holds in particular for casual users: usability is an important requirement
for them, but their needs may be easily overlooked in the case of collections
that, like the Dutch Folktale Database, were originally set up with scholarly
use in mind. Not all similar projects need to follow exactly the same steps as
ours; however, we believe that (1) getting to know the users and their needs and
(2) testing interface design choices with representative users before
implementing them are essential steps in any interface design process. Even when
done on a small scale and with limited resources, these steps can provide
valuable insights.
Our project resulted in several flexible exploration tools and interfaces that
exploit the rich metadata in the Dutch Folktale Database for use in faceted
search and browsing. The interfaces provide a bird’s-eye view of the collection,
allowing both casual users and experts to find useful perspectives on the data.
We expect this will encourage casual users to discover more of our national
cultural heritage, and help researchers to answer both old and new research
questions on a larger scale than was previously possible. In the last decades a
number of national folktale database initiatives have been launched in different
countries. Our tools can form the basis for an online platform for future
cooperation and international data sharing between these folktale databases,
making these treasure troves of oral culture accessible to scholars and
non-scholars alike.
The newly developed interfaces have been integrated into the website of the Dutch
Folktale Database. The next step is to determine whether this indeed has the
intended effect of retaining casual users for a longer period of time,
encouraging them to explore more folktales, and having them return more often to
the website. To this end, a new round of user data collection needs to be done
using Google Analytics, and the results need to be compared to our earlier
findings. However, this remains as future work. Also future work is an analysis
to investigate whether the new interfaces indeed lead to be more unique content
being accessed. A comparison of folktale documents by a combination of keywords,
subgenre, subject, motifs etcetera showed that about 5% of all documents have no
direct neighbours in the collection. These folktales will not show up in the
network visualisation currently employed on the website, but they can be exposed
via the faceted browsing and map-based interfaces. It remains to be seen whether
this is sufficient, or if more needs to be done to facilitate discovery of these
items.
Acknowledgements
We would like to thank everybody who participated in our polls and experiments.
We also thank the reviewers for their useful suggestions. This research was
supported by the Folktales as Classifiable Texts (FACT) project, part of the
CATCH programme funded by the Netherlands Organisation for Scientific Research
(NWO).
Works Cited
Abello et al. 2012 Abello, J., Broadwell, P. and
Tangherlini, T. (2012). “Computational
Folkloristics.”
Communications of the ACM, 55(7), pp. 60–70.
Brooke 1996 Brooke, J. (1996). “SUS: A ‘Quick and Dirty’ Usability
Scale.” In: P. Jordan, B. Thomas, B. Weerdmeester, and A. McClelland,
eds., Usability Evaluation in Industry. London:
Taylor and Francis.
Brown 1999 Brown, C. (1999). Human-Computer Interface Design Guidelines. Exeter: Intellect
Books.
Elbedweihy et al. 2012 Elbedweihy, K.
Wrigley, S. and Ciravegna, F. (2012). “Evaluating Semantic
Search Query Approaches with Expert and Casual Users.” In: The Semantic Web (ISWC 2012), Berlin Heidelberg:
Springer Verlag, pp. 274-286.
English 2002 English, J., Hearst, M., Sinha, R.,
Swearingen, K. and Yee, K. (2002). “Flexible Search and
Navigation Using Faceted Metadata.” In: Proceedings of the 25th Conference on Research and Development in
Information Retrieval (SIGIR 2002), New York: ACM, pp. 11–15.
Gould and Lewis 1985 Gould, J. and Lewis, C.
(1985). “Designing for Usability: Key Principles and What
Designers Think.”
Communications of the ACM 28(3), pp.
300-311.
Harrower and Fabrikant 2008 Harrower, M. and
Fabrikant, S. (2008). “The Role of Map Animation for
Geographic Visualization.” In M. Dodge, M. McDerby and M. Turner
(eds.): Geographic Visualization: Concepts, Tools and
Applications, John Wiley & Sons, Ltd, Chichester, UK, (2008):
pp. 49-65.
Jones et al. 2009 Jones, C., Haklay, M., Griffiths,
S. and Vaughan, L. (2009). “A Less-is-more Approach to
Geovisualization -- Enhancing Knowledge Construction across
Multidisciplinary Teams.”
International Journal of Geographical Information
Science, 23(8), pp. 1077-1093.
Khoo et al. 2008 Khoo, M., Pagano, J., Washington,
A., Recker, M., Palmer, B. and Donahue, R. (2008). “Using
Web Metrics to Analyze Digital Libraries.” In: Proceedings of the 8th ACM/IEEE-CS Joint Conference on Digital Libraries
(JCDL '08), New York: ACM, pp. 375-384.
La Barre and Tilley 2012 K. La Barre, K. and
Tilley, C. (2012). “The Elusive Tale: Leveraging the Study
of Information Seeking and Knowledge Organization to Improve Access to and
Discovery of Folktales.”
Journal of the Association for Information Science and
Technology 63(4), pp. 687-701.
Lund 2001 Lund, A. (2001). “Measuring Usability with the USE Questionnaire.”
Usability Interface 8(2), pp. 3-6.
Meder 2010 Meder, T. (2010). “From a Dutch Folktale Database towards an International Folktale
Database.”
Fabula 51(1-2), pp. 6-22.
Muiser et al. 2012 Muiser, I. Theune, M. and T.
Meder, T. (2012). “Cleaning up and Standardizing a Folktale
Corpus for Humanities Research.” In: Proceedings
of the Second Workshop on Annotation of Corpora for Research in the
Humanities 2012 (ACRH-2), Lisbon: Edições Colibri, pp. 63-74.
Nguyen et al. 2012 Nguyen, D., Trieschnigg, D.,
Meder, T. and M. Theune, M. (2012). “Automatic
Classification of Folk Narrative Genres.” In: LThist 2012: First International Workshop on Language Technology for
Historical Text(s), Vienna: ÖGAI, pp. 378–382.
Nguyen et al. 2013 Nguyen, D., Trieschnigg, D.,
and Theune, M. (2013). “Folktale Classification Using
Learning to Rank.” In: Proceedings of the 35th
European Conference on Information Retrieval (ECIR 2013), New York:
ACM, pp. 195-206.
Nguyen et al. 2014 Nguyen, D., Trieschnigg, D. and
M. Theune, M. (20104). “Using Crowdsourcing to Investigate
Perception of Narrative Similarity.” In: Proceedings of the 23rd Conference on Information and Knowledge Management
(CIKM 2014), New York: ACM, pp. 321-330.
Preece et al. 2015 Preece, E., Sharp, H, and
Rogers, Y. (2015). Interaction Design. 4th ed.
Chichester: John Wiley & Sons.
Ruecker et al. 2011 Ruecker, S. Radzikowska, M.
and Sinclair, S. (2011). Visual Interface Design for
Digital Cultural Heritage: A Guide to Rich-prospect Browsing.
Farnham, Surrey: Ashgate Publishing.
Stephenson 1999 C. Stephenson (1999). “Recent Developments in Cultural Heritage Image Databases:
Directions for User-Centred Design.”
Library Trends, 48(2), pp. 410-37.
Tehrani 2013 Tehrani, J. (2013). “The Phylogeny of Little Red Riding Hood.”
PloS one 8(11):e78871.
Trant 2006 Trant, J. (2006). “Exploring the Potential for Social Tagging and Folksonomy in Art Museums:
Proof of Concept.”
New Review of Hypermedia and Multimedia, 12(1), pp.
83-105.
Trieschnigg et al. 2012 Trieschnigg, D.,
Hiemstra, D., Theune, M., de Jong, F. and T. Meder, T (2012). “An Exploration of Language Identification Techniques for the
Dutch Folktale Database.” In: Proceedings of the
Adaptation of Language Resources and Tools for Processing Cultural Heritage
workshop at LREC 2012. Istanbul: ELRA, pp. 47-51.
Trieschnigg et al. 2013a Trieschnigg, D.,
Nguyen, D. and Meder, T. (2013). “In Search of Cinderella: A
Transaction Log Analysis of Folktale Searchers.” In: Proceedings of the First ACM SIGIR Workshop on the
Exploration, Navigation and Retrieval of Information in Cultural Heritage
(ENRICH 2013).
Trieschnigg et al. 2013b Trieschnigg, D.,
Nguyen, D. and Theune, M. (2013). “Learning to Extract
Folktale Keywords.” In: Proceedings of the 7th
Workshop on Language Technology for Cultural Heritage, Social Sciences, and
Humanities (LaTeCH 2013), Stroudsburg: Association for Computational
Linguistics, pp. 65-73.
Uther 2004 Uther, H.J. (2004). The Types of International Folktales: A Classification and Bibliography
Based on the System of Antti Aarne and Stith Thompson. Vols 1-3.
Helsinki: Suomalainen Tiedeakatemia.