Abstract
This essay responds to two questions at the heart of the Invisible Labor in the
Digital Humanities 2016 symposium at Florida State University: (1) what is at
stake in making unseen work visible, and (2) how can DH projects equally
distribute and value the labor involved in their construction? For us, the
answer to these questions lies in privileging the pedagogical affordances of
data construction by crafting a workflow that included undergraduates as
intellectual partners, and using DH methods to visualize and make public this
collaborative labor. By drawing on our work with Photogrammar, which visualizes
federal New Deal documentary projects including photography and life histories,
we highlight three strategies for making labor visible in the digital
humanities. First, we discuss how this project served as a tool for teaching
undergraduate students key methods in DH by giving them experience with
conducting original research with credit on the public site. In this way, we
explain how pedagogy can become a part of project development. Second, we argue
that DH visualization techniques can make the labor behind DH projects visible.
We focus on how Photogrammar uses a timeline and network analysis alongside the
traditional “About” page to make visible all
participants in the project. Third, we turn to an open discussion of the
challenges faced in the politics of attribution when working with university,
governmental and private historical organizations, including domain names and
the use of organizational logos.
In an effort to justify new methods of social documentation, W.T. Couch (1939)
declared, “The people, all the people, must be known, they must
be heard. Somehow they must be given representation, somehow they must be given
a voice and allowed to speak, in their essential character”
[
Couch 1939, x–xi]. His zeal for a new method of documenting
social history reflected his belief in a more democratic vision of American
expression, which also starkly contrasted with growing fascism in Europe during the
1930s. In order to give “the people their voice,” he
helped to craft the Southern Life Histories Project, which charged Federal Writers’
Project (FWP) workers with interviewing and documenting the lives of everyday people
in the American South. The collection is composed of nearly 1200 life histories that
are entertaining, insightful, heartbreaking, and, on the whole, say as much, if not
more about the writers than the interviewees. Because of the outbreak of WWII and
political turmoil within the program, there is not much remaining evidence relating
to the interviewees, the writers, the editors, or how precisely these life histories
were written. Instead what remains are the stories themselves, while the labor
behind them is obscured even rendered invisible.
As many Digital Humanities (DH) scholars and workers know, this situation of having a
product with little to no knowledge of the labor behind its construction is rather
common. We create DH projects for particular audiences, but the decisions and labor
behind their construction remain hidden as they are not the end goal of the
projects. At the November 2016 Symposium on Invisible Labor in the Digital
Humanities at Florida State University, Mark Algee-Hewitt referred to this issue as
one of the great paradoxes of DH. In order to better understand this great paradox,
the symposium centered on three key themes: (1) divergent expectations, (2) unequal
labor, and (3) invisible work. Within each of these themes was a discussion of the
core tension in collaborative DH projects about how to distribute and value labor,
especially when decisions about the direction of research and allocation of funding
are not evenly dispersed, which is often the case in the hierarchical system of the
academy.
In discussing these broader themes, the topic of student labor emerged, which by and
large is an area that DH has yet to properly take on, especially undergraduate
student labor. As Spencer D.C. Keralis explains in his poignant chapter on labor in
Digital Pedagogy in the Humanities: Concepts, Models, and
Experiments, “if there is a spectre haunting digital
pedagogy, it is the spectre of labor”
[
Keralis 2016, 4]. This spectre results from the fact that
students are often given what is thought of as the most mundane work, such as
scanning material and data entry. Labor that is “rendered
invisible, alienable, and is easily effaced and taken for granted” when
looking at the final product. While such a labor structure is almost always
uniformly bemoaned as unfortunate and unfair, few actually take the time and effort
to work to disrupt it in their own DH work. In order to address this spectre of
labor, we ask what would it mean to turn this seemingly mundane or taken-for-granted
work into an opportunity to teach and re-envision undergraduate DH pedagogy? How can
we use DH methods themselves as the means to represent such labor? This essay
answers these questions by outlining our efforts to address labor inequities through
our work with Photogrammar, which visualizes federal New Deal documentary projects
including photography and life histories. For us, the answer to these questions lied
in privileging the pedagogical affordances of data construction by crafting a
workflow that included undergraduates as intellectual partners, and using DH methods
to visualize and make public this collaborative labor.
We will begin with an overview of Photogrammar and the constellation of labor that
the project has required, and then highlight two strategies for valuing labor and
making labor visible in the digital humanities. First, we discuss how this project
served as tool for teaching undergraduate students key methods in DH by giving them
experience with conducting original research with credit on the public site. In this
way, we explain how pedagogy can become a part of project development. Second, we
argue that DH visualization techniques can make the labor behind DH projects
visible. We focus on how Photogrammar uses a timeline and network analysis alongside
the traditional “About” page to make visible all participants in the
project.
[1] We end by
discussing politics of attribution when working with university, governmental, and
private historical organizations, including domain names and use of organizational
logos.
Context: Photogrammar, Southern Life Histories Project, and Data
Construction
In 2010, Photogrammar began as a collaboration between Lauren Tilton and Taylor
Arnold. Tilton was interested in the representational politics of the Farm
Security Administration-Office of War (FSA-OWI) Information, which employed
among the most influential documentary photographers of the century such as
Dorothea Lange, Walker Evans, and Gordon Parks. They produced iconic photographs
of the Great Depression that were often in support of the New Deal state and,
with the onset of World War II, turned their gaze toward constructing an image
of an affluent and strong nation ready for war [
Stange 1986]
[
Trachtenberg 1988]. Yet, the collection was difficult to navigate
through the Library of Congress website. Tilton reached out to Arnold, a
statistician, and they worked together to scrape and map the 170,000 photographs
from the collection. They developed a prototype, which then received an NEH
Office of Digital Humanities grant.
With the grant, the collaboration extended to include Laura Wexler, who was the
grant’s Primary Investigator; Ken Panko and Trip Kirkpatrick, who served as
Project Managers; Stacey Maples, who served as the Map Expert; and Peter
Leonard, who served as an Implementation Coordinator. Tilton and Arnold were
named Co-Directors. Over the next several years, they built the web-based
platform for organizing, searching, and visualizing the 170,000 photographs from
the FSA-OWI. In 2015, Courtney Rivard from the University of North Carolina,
Chapel Hill joined the Photogrammar team with the idea of adding aspects of the
Federal Writers' Project as a map layer. Then in 2016, Photogrammar received an
ACLS Digital Extension Grant to place the FSA-OWI photographs in the larger
federal effort to document America during the Great Depression. The grant
included funding to build out several components including the addition of the
Federal Writers’ Project’s Southern Life Histories Project from the University
of North Carolina, Chapel Hill’s Southern Historical Collection.
The Southern Life History Project (SLHP) was part of the larger Federal Writers’
Project created under the New Deal as a way to put unemployed writers to work.
In many ways, the SLHP marked a major shift in forms of documentary expression
as its goal was to capture the life stories of everyday Americans from their own
perspectives. W.T. Couch saw these life histories as way to collect accurate and
authentic accounts of the hardships of life during the Depression with special
attention to marginalized voices such as African Americans, women, and working
class individuals. For him, the South faced many problems that needed to be
solved, but sociological data that focused on data and numbers obscured the
realities of life and failed to move a general public to enact necessary
changes. Instead he thought that real stories by real people constituted the
type of evidence that had the power to create change. However, like other forms
of documentation that purported authenticity, the life histories tell readers as
much about their creators, in this case the federal writers, as they do the
interviewees. Moreover, the writers’ use of representational practices often
demonstrate how racism, sexism, and inequality were perpetuated in stories of
the quotidian. Because of their complicated composition, they serve as an
important companion to the FSA-OWI photographs that were taken during that same
time period. Both projects sought to document the American experience and
negotiate the desires and needs of those who documented, those who were
documented, and the funding agencies. Our goal was to bring together these life
histories and the FSA-OWI photographs in the Photogrammar platform to allow
users to explore the documentary work of the Great Depression era, and the
reason many scholars have labeled it the “documentary
decade”
[
Stott 1973]
[
Finnegan 2003].
When making the first version of Photogrammar, the project greatly benefited from
decades of work by the Library of Congress to digitize the photos and to create
the extensive metadata that accompanied them. This was not the case with the
life histories. Like many other projects involving archival documents, the life
histories layer necessitated creating, cataloguing, and organizing metadata from
the archival material, together with marking up and cleaning the individual
documents before the material was ready to be integrated into the Photogrammar
platform. In this case, the metadata centered around the names, races, and
genders of both the writers and interviewees for each life history so as to
optimize search functionality within the collection as well as to generate
visualizations that analyzed the collection in new ways. While this may seem a
straightforward process, it was quite murky as the metadata had to be
extrapolated from stories created through a writer’s interpretation of an
interviewee’s life often written as a conversation that did not unfold in a
linear progression.
This data construction phase of the project is often the backbone of DH projects,
especially those that use visualization and text analysis. While this process is
crucially important, it is frequently the part of the project that receives the
least attention and attribution. Such inattention is likely because data is
often understood as that which is given, or as already existing [
Rosenberg 2013]. One frequently hears a DH scholar talk about
“their corpus” of books, photographs, or archival
material. Yet, making these sources computationally tractable is a significant
undertaking. Turning a PDF of a piece of writing into clean, plain text can take
expensive software and people who manually correct errors. Organizing the
sources online or for analysis often involves creating a tabular database; a
process that requires creating metadata. Bringing attention to the
constructedness of the process is one of the reasons Johanna Drucker argued for
using capta, that which is captured, rather than the term data [
Drucker 2011]. In reality, making a corpus requires countless
decisions over what actually counts as data and how to create such data.
Therefore, by referencing “the corpus” both the interpretative decisions in
data creation and the labor that makes data available (particularly those who
collect, store, and preserve these sources) are obscured through the singularity
of the term. Moreover, data construction is just one component of the
complicated labor network of digital projects. Responding to the work of
scholars such as Amy Earhart, Miriam Posner, and Roopika Risam, Spencer Keralis
explains:
The labor network necessary to produce digital projects
is complex, ranging from the physical labor of maintaining hardware and
the infrastructure essential to these projects, to hybrid labor “in
which machines combine with humans to perform tasks” in software
or with devices, to scripted tasks performed automatically within
systems, to the writing of those scripts, to the knowledge work that
serves as the intellectual foundation of a project, to the
instrumentalized labor of workers who perform repetitive tasks that
cannot be scripted
[Keralis 2016, 4].
In efforts to re-envision the
data construction phase of this project and dwell in the murkiness of its labor
rather than to move past it as quickly as possible to get to the final product,
we used the data construction phase as a pedagogical opportunity to teach
students about the rhetorical nature of data. We aimed to animate the
undergraduate classroom by including students in the decision process for one
way of valuing labor is identifying opportunities and outcomes that also benefit
the person laboring. We accomplished this by building Rivard’s new course-based
undergraduate research experience (CURE) classes into the data construction
phase of the project.
Building Pedagogy into Project Development
Many DH practitioners have noted the lack of opportunities available to
undergraduate students to gain DH skills and experience unless they are able to
join a research project run by a DH scholar in their university [
Anderson, et al. 2016]. Moreover, the students who become part of such
projects are often thrown into the projects and told to “figure it out” making for a challenging process of skills
acquisition. This problem of giving undergraduates genuine research
opportunities while at the same time teaching them necessary methods and
research skills is one faced by most areas of the university. To address this
issue, many universities have begun initiatives to incorporate genuine or
“real” research projects into the classroom often in the form of CURE
courses (Course-based Undergraduate Research Experience) [
Ishiyama 2002]
[
Lopatto 2010]. While such courses are most common in STEM fields,
we aimed to merge this approach with the project development of the life history
layer of Photogrammar. In other words, rather than viewing data construction as
a monotonous task that needed to be quickly accomplished, we used it to
accomplish pedagogical goals that focused on undergraduate research and skill
acquisition, thereby re-envisioning this labor as pedagogical in nature by
shifting our understanding of the goal of data construction.
This approach of building pedagogy into DH project development was aided in large
part by the organizational structure of the Southern Life History Collection
(SLHC) and pedagogical resources made available by UNC, two factors that must be
in place to enact this type of project development. The SLHC is located at the
Southern Historical Collection on UNC’s campus, which meant that students had
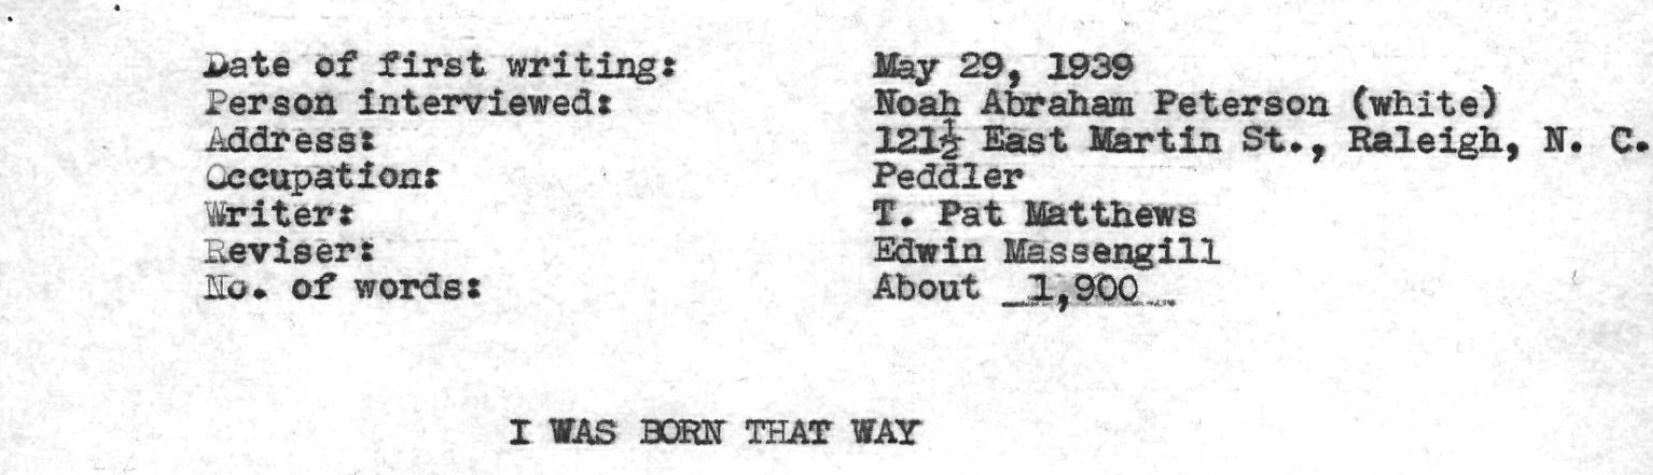
easy access to the original archival material. Additionally, though written in
the 1930s, the writers of the life histories already understood the importance
of collecting data to organize its collection because at the beginning of almost
every life history is a listing of extremely helpful metadata including
information relating to the writer and the interviewee (see Figure 1). This
easily discernible metadata that introduced a reader into the life history
provided the beginning of metadata schema that could be used to organize the
data that would be incorporated into Photogrammar. It would have been possible
to simply use this schema to generate the data needed for the project ourselves;
something that we could have done rather quickly. Instead, we decided to slow
the data construction process down in order to turn it into a pedagogical
opportunity to include undergraduates in a course-based setting. The importance
of engaging students in the data construction process has been well-documented
in the literature on statistical education, an idea that should be extended into
DH pedagogy [
Hydorn 2018].
Additionally, the decision to incorporate undergraduate pedagogical goals into
the data construction process of the project was influenced by an initiative at
UNC to promote CURE courses across campuses, which included providing faculty
with resources on how to incorporate authentic research experiences within the
structure of a class. At the same time, Rivard was collaborating with a faculty
working group at UNC focused on bringing data studies into humanities
curricula.
[2] Therefore, UNC offered concrete resources and incentives to
promote course-based undergraduate research that fostered the development of DH
skills. Such resources and incentives allowed us the opportunity to take
pedagogical risks.
Seizing these opportunities, we brought students into the project as
collaborators in a new upper division, undergraduate course at UNC taught by
Rivard on digital rhetoric in Spring 2016 and again in 2017.
[3] Students were positioned as leaders of the North
Carolina section of the Life Histories Collection, which constituted
approximately 600 life histories. As will be explained in greater detail below,
students were charged with creating a metadata schema for the inclusion of these
life histories in Photogrammar, and then to use this data as the basis of a
research project that they could publish in an undergraduate research journal.
By bringing students into the Photogrammar project, Rivard aimed to demonstrate
to students the ways in which data construction was a rhetorical act as
students, themselves, were in charge of the decisions behind the data.
Such an approach of learning by doing is at the heart of recent advances in the
field of digital rhetoric. Douglas Eyman defines digital rhetoric “as the application of rhetorical theory (as analytic method or
heuristic for production) to digital texts and performances” that
must provide methods for both evaluation and making [
Eyman 2015, 44]. To teach students the methods of evaluation and making embedded
with Eyman’s conception of digital rhetoric, a number of scholars in Composition
and Rhetoric have demonstrated the need to more specifically focus on
information literacies and data literacies [
Purdy 2011]
[
Sweeney 2012]
[
Vetter 2014]. To this end, Nathan Johnson argues for centering
information infrastructure within rhetorical studies, explaining “infrastructure provides the invisible scaffolding for
discovery, dissemination, access to information,” and as such has
real consequences for “public communication, knowledge, and
political life”
[
Johnson 2012, 1]. Therefore, teaching students not only how
to navigate, but also to construct information infrastructures is key to
developing information and digital literacies.
These are, of course, the same goals that shape much of DH pedagogy as Alexander
Reid explains. He writes, “the promise of the digital
humanities lies in its potential to address the political, ethical, and
rhetorical challenges of living in a digital age”
[
Reid 2015, 16]. Therefore, many in DH promote curriculum
that allows for “tinkering”
[
Sayers 2012] and as Burdick, et. al. explain “hands-on, experiential, and project-based learning through doing”
[
Burdick, et al. 2016]. However, this approach has often led to what
Brandon Locke calls “tool based literacy” in which
students develop “‘tech skills’...through narrow
technology that limits potential outcomes and often monetizes user-created
content”
[
Locke 2017]. Such an approach can be helpful as it allows for
“low stakes”
[
Anderson 2008] tinkering, but it does not train students in, as
Locke states, the “critical evaluation of digital media and
the means to produce them”
[
Locke 2017].
We argue that cataloguing, indexing, and curating archival materials offer one
avenue for teaching students data and information literacies while avoiding a
tool-based approach.
[4] This approach simultaneously demonstrates the consequences
that information infrastructure has on shaping knowledge about the past. As
Graban, et. al explain, “the means of archival organization
are rhetorical acts deploying arguments about relations, power dynamics, and
gate-keeping methodologies and should be treated as such”
[
Graban 2015, 237]. Therefore, inviting students to come into
a project in which they were responsible for creating the system used to
describe archival materials put them in the driver's seat of this powerful act
of shaping the information infrastructure of our DH project. Specifically we
charged students with: (1) creating a metadata schema for the inclusion of the
life histories as layer for Photogrammar, (2) generating metadata for ten life
histories, (3) marking up three life histories with XML, (4) giving a Skype
presentation to Tilton outlining their rationale for the metadata and mark-up
schema, and (5) creating data visualizations from the metadata to construct an
original argument that they then were encouraged to publish in
People, Ideas, and Things, an undergraduate research
journal at UNC.
Knowing that they had the power to shape the infrastructure of the life history
layer helped motivate students to think critically about their decisions,
especially those involving their metadata schema and tagging decisions. For
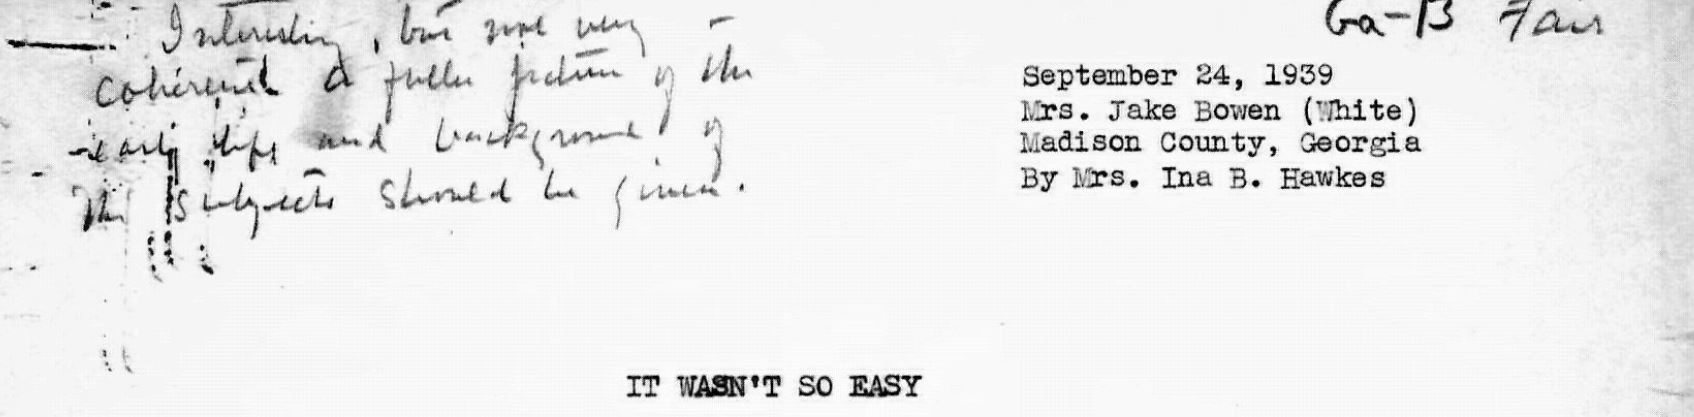
example, students deeply struggled over how to tag gender and racial categories.
There are many instances in the life histories in which the writers named women
with their husbands’ names as was common at the time as seen in the story of
Mrs. Jake Bowen in Figure 2. Students had to decide whether to tag her with her
husband’s first name, i.e. Jake, or read the story for context clues for her
first name, Virginia. Therefore, they grappled with whether or not to
replicate the documentation system of the federal writers to maintain
authenticity or employ more inclusive practices in line with contemporary
standards. These are the same issues faced by archivists today, so we looked to
articles such as Duarte and Belarde-Lewis’ excellent piece, “Imagining: Creating Spaces for Indigenous Ontologies” to learn about
ideas such as co-locating and composing for audiences represented in the
collections rather than colonialist naming practices [
Duarte 2015]. This led students to also decide to co-locate racial categories. The federal
writers used racial categories common to 1930s, which the students found
unacceptable and impractical for a contemporary user, so they chose to use
multiple terms for each racial category. One student, Julie Hayes, explained
this point in her final paper, which was published in UNC’s
People, Ideas, and Things journal. She stated, “this procedure [of data construction] involved much rhetorical
decision-making; for instance, outdated racial terms were replaced with more
contemporary and searchable words, thus reflecting the shifts in social
norms in regard to race and the resultant changes in language”
[
Hayes 2017]. Therefore, by thinking through the consequences of
their tagging systems, students understood their work as knowledge
production.
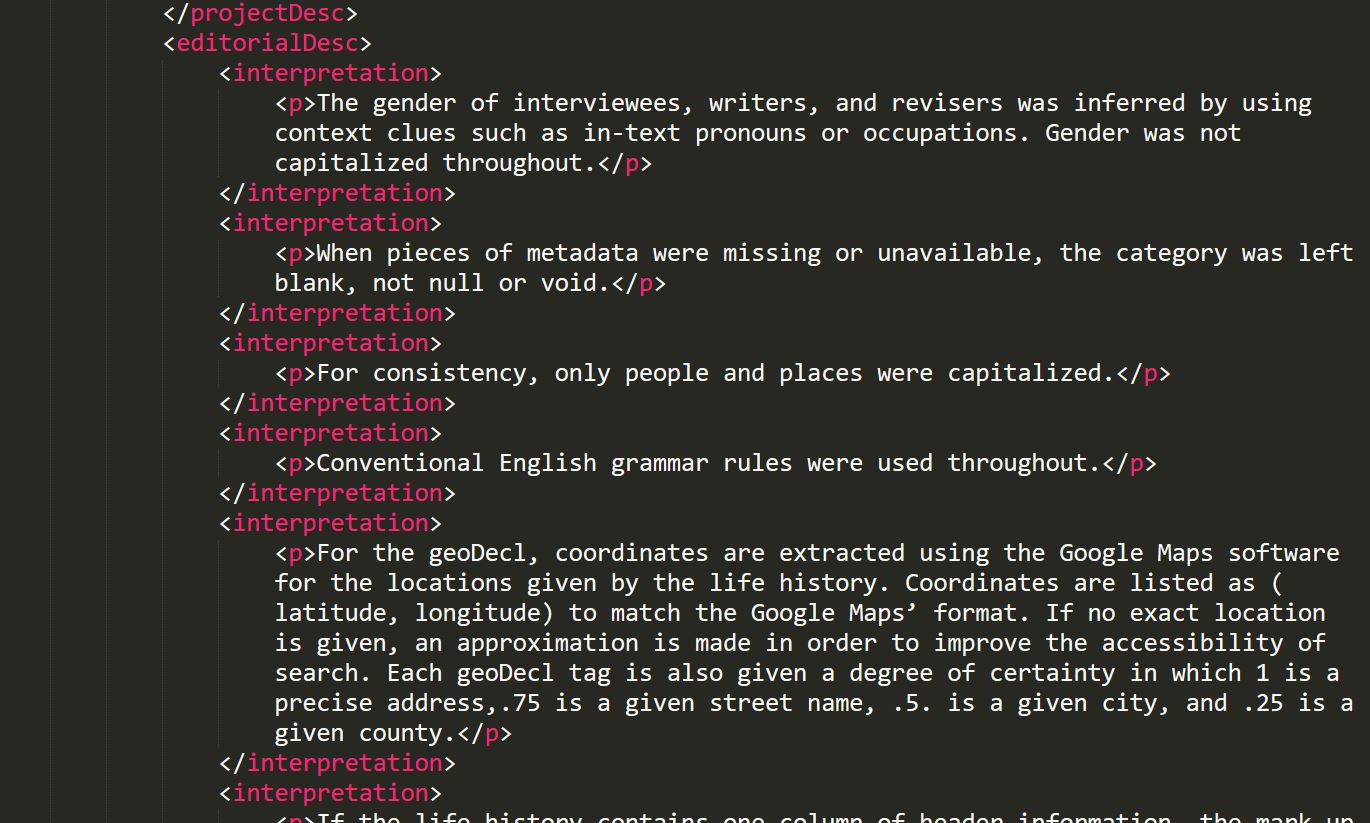
In order to encourage students to think about how to make their decisions
transparent by documenting them, they included them in their XML headers with
interpretation tags within the project description (see figure 3). After tagging
their life histories and marking them up, students used Tableau to visualize
their data. Here they looked for patterns in the archive by analyzing it from a
distance [
Underwood 2017], an approach that had never been used to
analyze this collection. Knowing that they were looking at the collection in new
ways because of the data that they constructed gave them a profound sense of
accomplishment, and positioned them as knowledgeable researchers in their own
right. Moreover, their decisions fundamentally shaped the infrastructure of the
Photogrammar project. Therefore, students learned digital skills such as data
visualization, mark-up, and database management while developing critical
digital literacies that saw data construction as knowledge making. Though we
could have certainly come up with a metadata schema for the life histories more
quickly in a few weeks rather than over the span of a year, the pedagogical
affordances of this approach were an important end in themselves, and gave
students the opportunity to work on DH project that is legible and transferable
to their future endeavors. In order to focus on transfer, Rivard spent the last
week of the course helping students translate their classwork into points on
their resume as well as addressing how to discuss the project in an interview.
As a result of this focus on transfer, a number of students have used the
project to secure internships and summer research opportunities.
Together with these course-based experiences, many students at UNC and the
University of Richmond were eager to participate in the Photogrammar project,
which led us to hire Research Assistants (RA). We tried to find a balance
between the needs of the project and the kinds of experiences the RAs sought by
working with each RA to identify the type of work that would help them
accomplish their scholarly and professional goals. A number of students who were
in Rivard’s classes — Carla Aviles, Karissa Barrera, Kayley Bryson, Sarah Moody,
Sara Siemens, Elizabeth Bonesteel, Grace Hildebrand, Scott Robinson, and Lacie
Morrison — asked to continue to work on the project to gain experience that they
could put on their resumes. Grant Glass, a UNC English graduate student, also
helped with some text encoding to explore different theoretical methods that he
was planning to use in his dissertation. At the University of Richmond, three
students — Bal Artist, Emeline Blevins, and Emily Maanum — worked with Tilton
and Arnold at the University of Richmond. They expressed interest in being a
part of DH research beyond the Introduction to Digital Humanities course that
they took with Tilton. Blevins, for example, was interested in developing DH
skills with an eye toward jobs in museums and graduate studies. They worked
alongside the students at UNC to add metadata to the life histories. Because
they did not receive course credit, Richmond students collected hourly wages
according to university compensation rules. This growing group working on
Photogrammar required us to reevaluate how to give them credit and make their
important labor visible.
Visualizing Project Labor
With an expanding set of collaborators, we wanted to highlight that certain
people contributed in different ways. Valuing labor means recognizing the
various ways people contributed, particularly those who put significant work
into a project. In order to make visible labor, we supplemented traditional
approaches of attribution with DH visualization methods. This resulted in our
utilization of three different forms of acknowledging labor: (1) a page on the
site listing and describing textually the Photogrammar team, (2) a timeline
capturing the length of time by contributor by component on the project, and (3)
a network visualization. While each form has it benefits and drawbacks, we
believe that taken together they better reveal the kinds and degrees of labor
necessary to build Photogrammar.
The most common form of acknowledging labor is the About or Team page. It often features
a list of participants and their roles starting with the PI or Director followed
by other team members. It is linear and hierarchical. In the case of
Photogrammar, a Team page is available as a subsection of the About page. It
lists the people involved and their role. Such a page is particularly well
suited for explaining the current state of the project. When one lands on such a
page, they expect to see who, at that moment, is the current team and their
role. If one has a comment or question, they know who to contact.
Yet, there are drawbacks. The long list of students involved does offer a form of
credit, but it reads as a list that risks obscuring the amount of work
contributed. Those who are no longer involved in the project are often last,
regardless of the amount of work or time they spent on the project. Another
challenge is when roles shift. For example, Arnold and Tilton started
Photogrammar but could not serve as Primary Investigators on the grants since
they were graduate students, and later they were no longer affiliated with Yale
University. As a result, the Team page does not capture the four months Arnold
and Tilton spent building a prototype of Photogrammar or writing the NEH grant
before extending the project to include the larger team. It also does not make
clear when Project Management shifted from Ken Panko to Trip Kirkpatrick.
Certain students also moved from working within the classroom to Research
Assistants.
In order address these issues to more fully represent the labor in the project,
we sought strategies for how to balance acknowledging labor while giving
participants control over how their labor is documented. We heeded the advice
outlined in “A Student Collaborators’ Bill of
Rights”, developed by Miriam Posner and colleagues, to give students
control over how their role is represented. Students may want to reframe their
work according to their career aspirations as well as decide to no longer be
affiliated by removing their name [
DiPressi 2017]. To address
these issues, students were invited to create a GitHub page and provided with a
guide to developing their professional profile on the site. We then linked these
sites to their names on the Team page. The students then can customize their
GitHub pages to outline their roles on Photogrammar. As students move throughout
their studies and graduate, they can alter their profiles to meet their current
needs. Moreover, students did not have to develop a GitHub page, but the option
was available so that they could have control over how their labor is
framed.
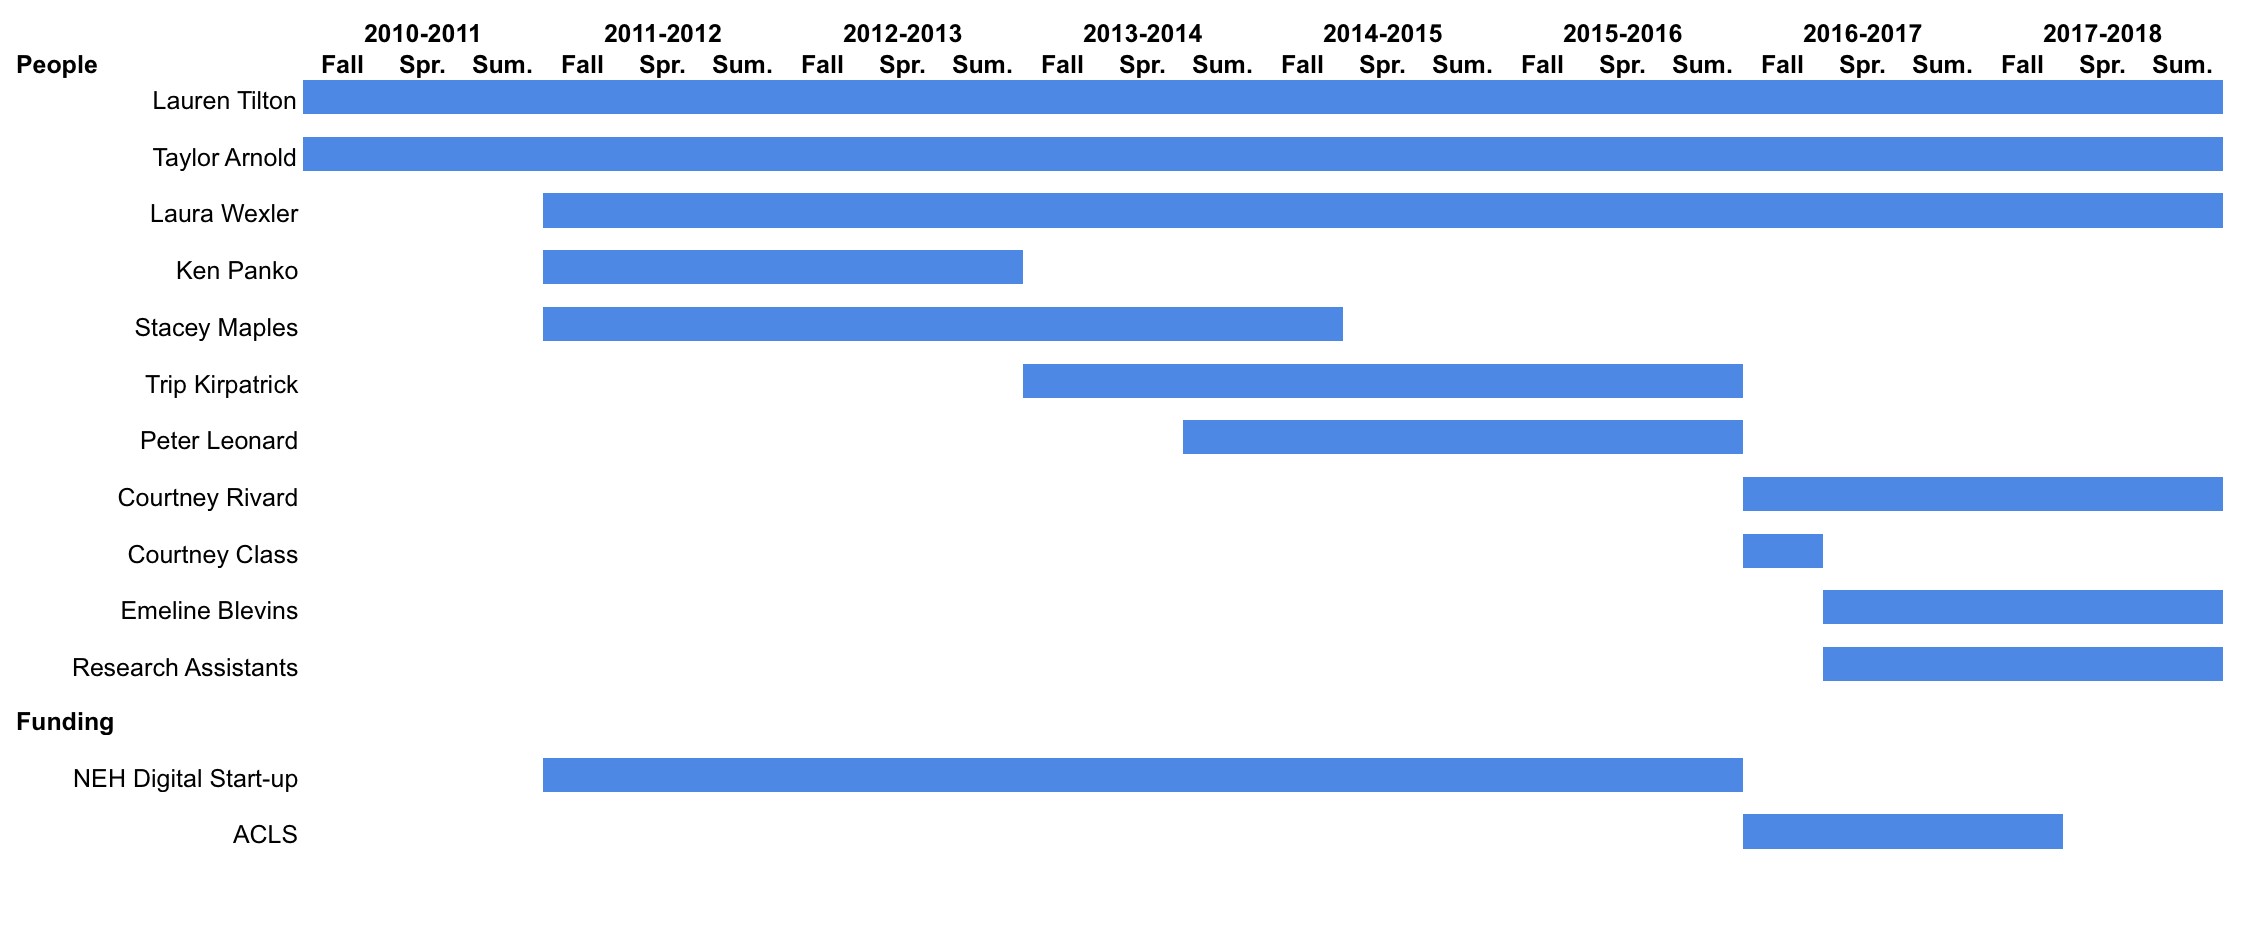
Yet, even when text is written to describe the work by a member of the team, this
can still make it difficult to capture the amount of time spent on the project
for the different contributors. To address these issues, we turned to a timeline
to capture the shifts in labor and funding within the project. For each
component of the project, we assigned the person to the time span they worked.
Work is broadly conceived to include physical as well as affective labor. Here
we can see the shifts in the project including the new collaboration with
Courtney Rivard and the UNC, Chapel Hill, which then resulted in an ACLS grant.
This strategy helped reveal how multiple institutions of higher education became
involved, an important aspect considering that student labor was used at Yale
University and then University of Richmond and UNC, Chapel Hill. Yet, the
timeline still has drawbacks for it assigns a particular task to each person
obscuring how interconnected and collaborative the process was and continues to
be. Here we turned to another visualization technique — networks.
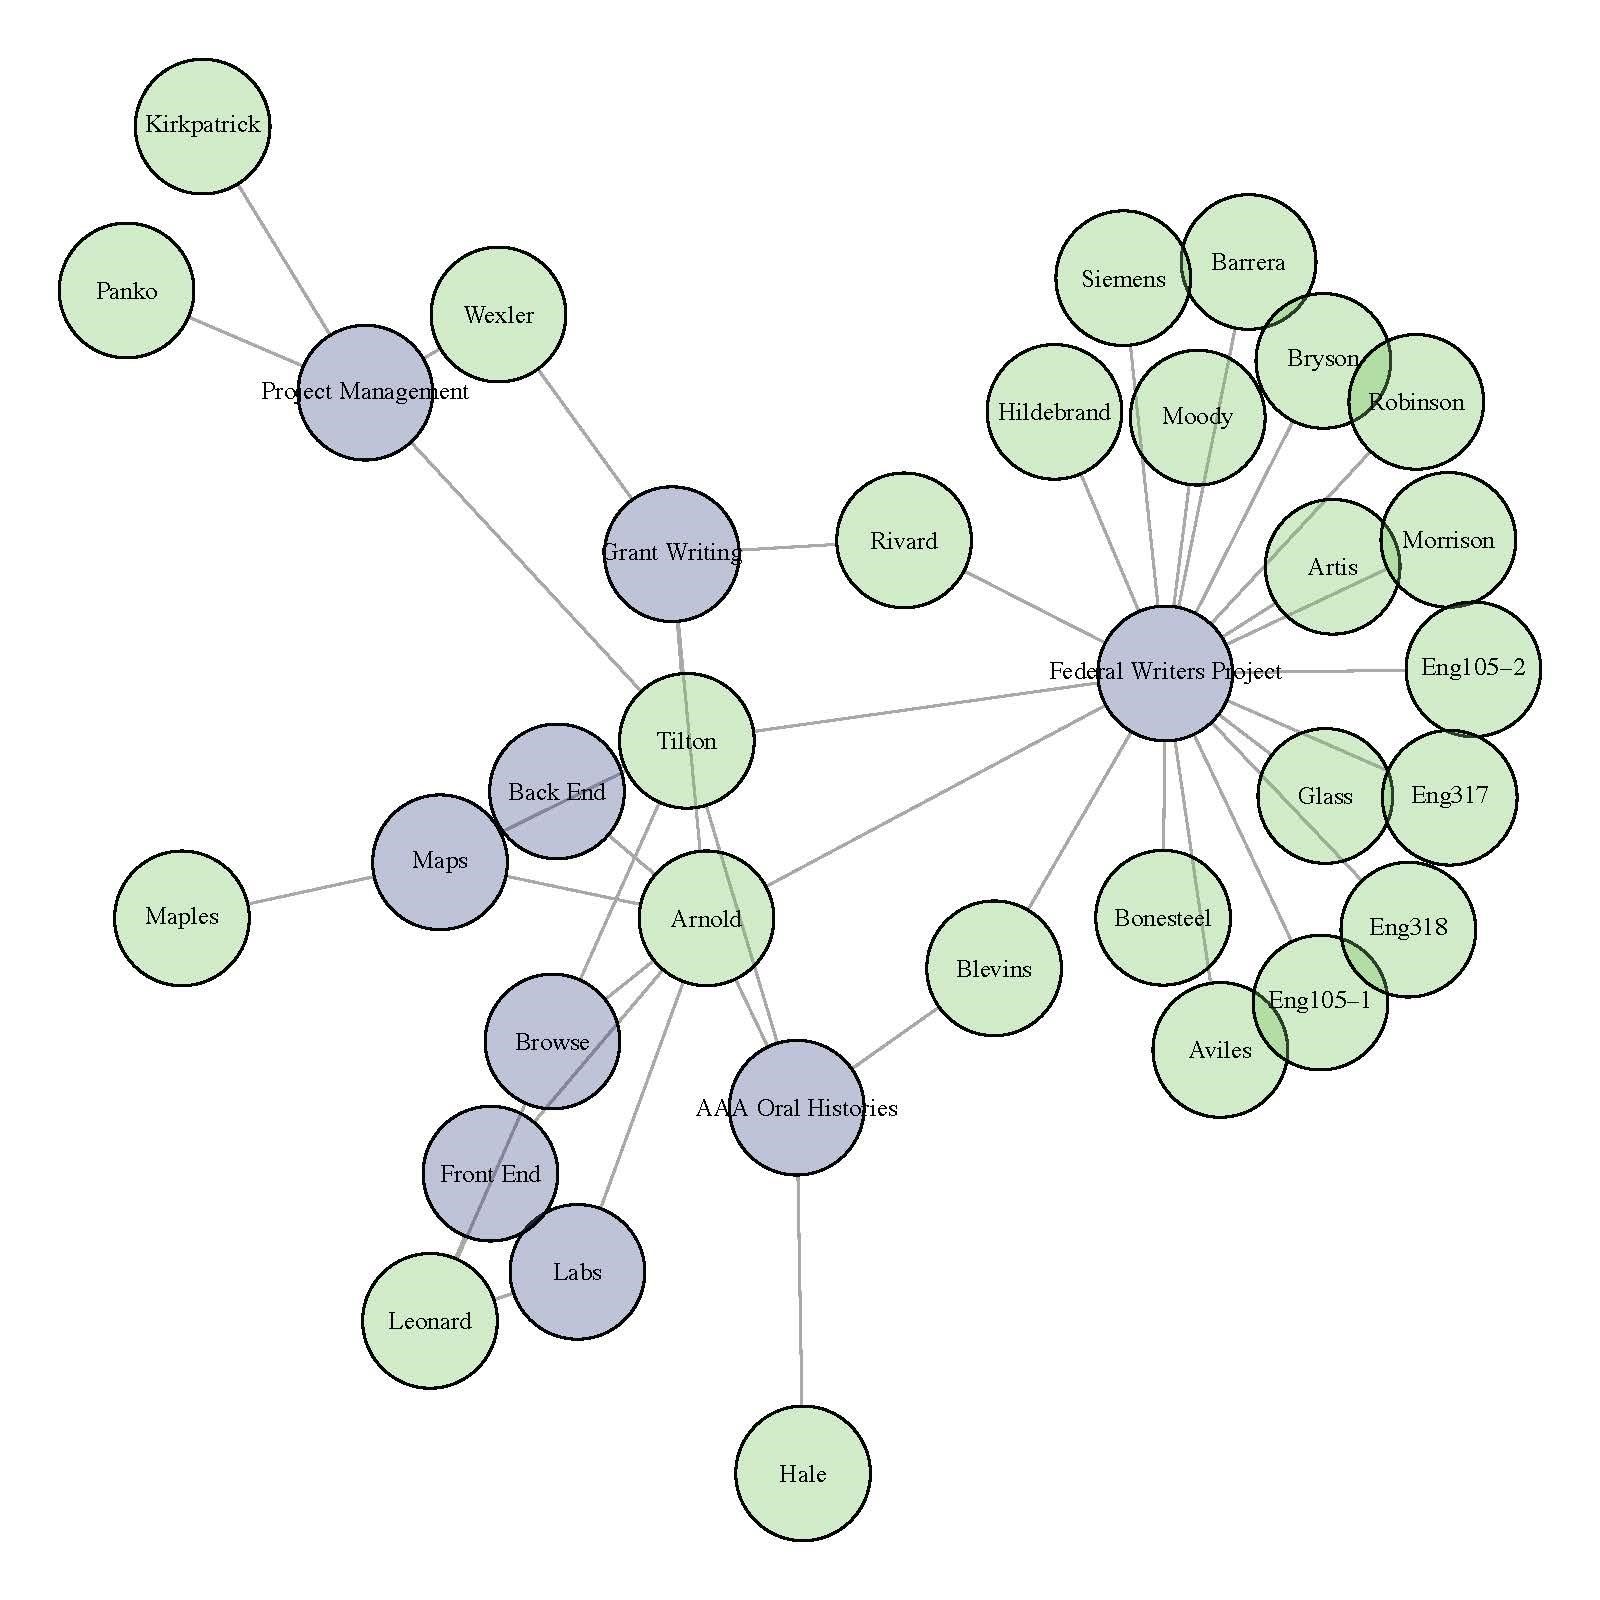
Network analysis is particularly well suited for revealing collaboration and
labor for it literally visualizes connections and interactions between people.
The bimodal graph connects each person to the component of the project they
helped build. In this case, labor included creating data or building a digital
components and includes people who contributed 1-2 days or several months of
work. We recognize that one drawback of networks is their ability to represent
time, making it difficult to denote the amount of labor; an issue the timeline
helps address albeit imperfectly. This strategy was particularly important for
acknowledging student labor. Whereas undergraduate student labor in the
classroom was noted at the course level in the timeline, each student who served
as a research assistant is a node and connected to the Photogrammar component
they worked on, which in most cases was the life histories. We developed a
network visualization particularly to increase the visibility of student labor.
The new visualizations of labor and GitHub links will be a part of a new version
of Photogrammar that will be released in 2020.
While these three methods help reveal a significant amount of the work on
Photogrammar, the issue of crediting labor is also why we will be changing
Photogrammar’s URL from photogrammar.yale.edu to photogrammar.org. While the
Photogrammar team did develop some new metadata about the FSA-OWI photographs,
it is deeply indebted to decades of work by the Library of Congress to digitize
the photographs and build the initial metadata [
Arnold 2017]. When
the project was released, media outlets such as CNN and Gizmodo incorrectly
credited Yale for releasing the photographs.
[5] This is despite the fact that the About
the Collection page outlines the work by the Library of Congress on the
collection and each photo includes a link back to the Library of Congress. Yet,
the URL sent the message that Yale owned these photographs. The issue is
particularly acute as we will be including documents from the Southern Life
Histories Collection, which is housed at the University of North Carolina,
Chapel Hill Southern Historical Collection in the next version. The new URL, we
hope, will help signal that the project is a multi-institutional collaboration
and ask people to look more closely at who is contributing to the project. This
will be augmented by logos from the participating institutions and funders when
possible.
Conclusion
Valuing the creation of the data undergirding DH projects is an ongoing
challenge. While it can be a mundane and monotonous task, data construction is
an interpretive, iterative, and inexact process. These very conditions
necessitate acknowledging and making visible the intellectual work that
undergirds DH data. Yet, it can be difficult as it asks us to be reflexive about
who is doing what and under what conditions. Such a challenge is why we framed
data construction as a pedagogical opportunity for undergraduates and used DH
methods to make visible the labor behind Photogrammar.
Our collaborative work with students was fundamentally motivated by a concern to
make sure student labor on Photogrammar served pedagogical goals rather than
just the labor needs of the project. Once we decided to work with
undergraduates, we have and continue to explore ways to give students credit
with a focus on increasing their visibility in the project alongside mechanisms
such as course credit and monetary compensation. These issues extend to how
Photogrammar gives credit to the partnerships that have made the project
possible. Our process has shortcomings and is not ideal for all projects.
Moreover, invisible labor will continue to haunt Photogrammar as it does across
DH and the academy. It can be difficult as it asks us to be reflexive about who
is doing what and under what conditions. Yet, we believe that revealing our
process and approaches by using methods that are now central to DH is a part of
the work we need to be doing as a field.
Works Cited
Algee-Hewitt 2016 Algee-Hewitt, Mark. 2016.
“The Invisible Lab: Collaborative Individualism and the
Paradox of the Digital Humanities.” Florida State University.
http://iwdh.cci.fsu.edu/schedule/.
Anderson 2008 Anderson, Daniel. 2008. “The Low Bridge to High Benefits: Entry-Level Multimedia,
Literacies, and Motivation.”
Computers and Composition 25 (1):40–60.
Anderson, et al. 2016 Anderson, Katrina, Lindsey
Bannister, Janey Dodd, Deanna Fong, Michelle Levy, and Lindsey Seatter. 2016.
“Student Labour and Training in Digital
Humanities.”
Digital Humanities Quarterly, 10 (1).
Arnold 2017 Arnold, Taylor, Stacey Maples, Lauren
Tilton and Laura Wexler. 2017. “Uncovering Latent Metadata
in the FSA-OWI Photographic Archive.”
Digital Humanities Quarterly, 11 (2).
Burdick, et al. 2016 Burdick, Anne, Johanna
Drucker, Peter Lunenfeld, Todd Presner and Jeffrey Schnapp. 2016. Digital_Humanities. MIT Press.
Couch 1939 Couch, William Terry, editor. These Are Our Lives. University of North Carolina
Press, 1939.
Duarte 2015 Duarte, Marisa Elena, and Miranda
Belarde-Lewis. 2015. “Imagining: Creating Spaces for
Indigenous Ontologies.”
Cataloging & Classification Quarterly 53 (5-6):
677–702.
Enoch 2015 Enoch, Jessica, and Pamela VanHaitsma.
2015. “Archival Literacy: Reading the Rhetoric of Digital
Archives in the Undergraduate Classroom.”
College Composition and Communication, 67 (2):
216.
Estes 2015 Estes, Adam Clark. “Yale Showcases 170,000 Incredible Photos of Depression-Era America.”
Gizmodo. October 5, 2015.
Eyman 2015 Eyman, Douglas. 2015. Digital Rhetoric: Theory, Method, Practice. University
of Michigan Press.
Finnegan 2003 Finnegan, Cara. 2003. Picturing Poverty. Washington, DC: Smithsonian.
Graban 2015 Graban, Tarez Samra, Alexis
Ramsey-Tobienne, and Whitney Myers. 2015. “In, Through, and
About the Archive: What Digitization (Dis) Allows.”
Rhetoric and the Digital Humanities. Eds. Jim
Rodolfo and Bill Hart-Davidson. Chicago University Press.
Groetzinger 2015 Groetzinger, Kate. “Yale has released 170,000 government photos of the Great
Depression.” Quartz. October 7, 2015.
Hayden 2015 Hayden, Wendy. 2015. “‘Gifts’ of the Archives: A Pedagogy for Undergraduate
Research.”
College Composition and Communication 66 (3):
402.
Hydorn 2018 Hydorn, Debra. 2018. “Engaging Students in the Practice of Statistics Through
Undergraduate Research.””
Journal of Statistics Education 26 (2):
87-91.
Ishiyama 2002 Ishiyama, John. 2002. “Does Early Participation in Undergraduate Research Benefit
Social Science and Humanities Students?”
College Student Journal 36 (3):381–387.
Johnson 2012 Johnson, Nathan R. 2012. “Information Infrastructure as Rhetoric: Tools for
Analysis.”
Poroi 8 (1): 10.
Keralis 2016 Keralis, Stephen. “Labor.” Digital Pedagogy in the Humanities: Concepts,
Models, and Experiments. MLA Commons, 2016.
Locke 2017 Locke, Brandon T. 2017. “Digital Humanities Pedagogy as Essential Liberal Education: A
Framework for Curriculum Development.”
Digital Humanities Quarterly, 11 (3).
Long 2015 Long, Heather. “Great
Depression: 170,000 incredible images now online.” CNN Money. October
20, 2015.
Lopatto 2010 Lopatto, David. 2010. “Undergraduate Research as a High-Impact Student
Experience.”
Peer Review, 12 (2): 27.
Purdy 2011 Purdy, James. 2011. “Three Gifts of Digital Archives.”
Journal of Literacy and Technology, 12 (3):
24-49.
Reid 2015 Reid, Alexander. 2015. “Digital Humanities Now and the Possibilities of a Speculative
Digital Rhetoric.”
Rhetoric and the Digital Humanities 15-19. Eds. Jim
Rodolfo and Bill Hart-Davidson. Chicago University Press.
Rosenberg 2013 Rosenberg, Daniel. 2013. “Data before the Fact.” In: Gitelman, Lisa. Ed. Raw Data is an Oxymoron. (Cambridge: MIT Press,
2013).
Sayers 2012 Sayers, Jentery. 2012. “Tinker-Centric Pedagogy in Literature and Language
Classrooms.”
Collaborative Approaches to the Digital in English
Studies, 279–300.
Sorapure 2010 Sorapure, Madeleine. 2010. “Information Visualization, Web 2.0, and the Teaching of
Writing.”
Computers and Composition 27 (1): 59–70.
Spiro 2012 Spiro, Lisa. 2012. “‘This Is Why We Fight’: Defining the Values of the Digital
Humanities.”
Debates in the Digital Humanities. University of
Minnesota Press.
Stange 1986 Stange, Maren, Symbols of Ideal Life: Technology, Mass Media, and the FSA Photography
Project. (Cambridge University Press, 1986).
Stott 1973 Stott, William. 1973. Documentary Expression and Thirties America.
University of Chicago Press.
Sweeney 2012 Sweeney, Meghan. 2012. “The Wikipedia Project: Changing Students from Consumers to
Producers.”
Teaching English in the Two Year College 39 (3):
256.
Trachtenberg 1988 Trachtenberg, Alan and
Fleischhauer, Carl and Brannan, Beverly W and Levine, Lawrence W, Documenting America, 1935-1943, 2, (University of
California Press, 1988).
Vetter 2014 Vetter, Matthew A. 2014. “Archive 2.0: What Composition Students and Academic Libraries
Can Gain from Digital-Collaborative Pedagogies.”
Composition Studies 42 (1): 35.
Vie 2008 Vie, Stephanie. 2008. “Digital Divide 2.0:‘Generation M’ and Online Social Networking Sites
in the Composition Classroom.”
Computers and Composition 25 (1): 9–23.