Abstract
In this paper, we present and discuss a promising research avenue, that is the use of
graph-based models and software for prosopographical data sets. Our case study will
be constituted by Romans 1by1 (http://romans1by1.com/), a digital-born prosopography
focusing on people attested in classical era inscriptions; it presently hosts
approximately 18,000 open access persons files. The project aimed at employing new
techniques and methodologies that come from other fields (i.e. computer science), in
order to approach the study of ancient population in an innovative way, to ease the
research, and to create an open-access tool, available for the academic community. In
the scope of this paper, we use Romans1by1 as an example to explore the perspectives
of ingesting the information from a prosopographical relational database into a graph
database.
I. Introduction
Prosopography is a branch of historical research that emerged during the 19th century
and soon became of major interest for the researchers of Antiquity. It is supposed to
be “a study that identifies and relates a group of persons or
characters within a particular historical or literary context”.
[1] As for
historical prosopography, K. Keats-Rohan canonically defines it as being“ about what the analysis of the sum of data about many individuals
can tell us about the different types of connection between them, and hence about
how they operated within and upon the institutions — social, political, legal,
economic, intellectual — of their time”
[
Keats-Rohan 2000]. While it was initially oriented towards well-known
elite personalities of the past, on whom information is rich, it has nowadays turned
more and more towards the “normal people” of the ancient world, thus going into
the depths of the socio-economic fabric of societies, revealed through micro-networks
and the connections between them.
In this paper, we present and discuss a promising research avenue, that is the use of
graph-based models and software for prosopographical data sets. Our case study will
be constituted by Romans 1by1 (
http://romans1by1.com/), a digital-born prosopography focusing on people
attested in classical era inscriptions; it presently hosts approximately 18,000 open
access persons files. The project aimed at employing new techniques and methodologies
that come from other fields (i.e. computer science), in order to approach the study
of ancient population in an innovative way, to ease the research, and to create an
open-access tool, available for the academic community. In the scope of this paper,
we use Romans1by1 as an example to explore the perspectives of ingesting the
information from a prosopographical relational database into a graph database.
Most digital prosopographies are built as relational databases using SQL or similar
query languages. Nowadays there is a trend toward exploring new approaches and new
software. One example in this context is SPEAR, a project which translates factoid
data into XML schemata [
Schwartz et al. 2022], and our current research
comes as a new undertaking in the said direction.
II. Graphs – a new way of insight into historical sources
Over the past years, a great number of human cultural records have been digitized.
They have been scanned, annotated, enriched with metadata and compiled in the form of
digital collections. Henceforward domain experts strive to inspect these collections
from multiple perspectives in order to understand their structure and inner
correlations. Yet, the most efficient ways of studying this new amount of digital
information still remain unclear. Traditional keyword or faceted searches rendering
list and table views allow approaching the collections in the spirit of a data
repository but they provide only little insight into patterns such as coverage,
interconnections, co-occurrences or dynamics over time. As a consequence, they are
often of only limited value, especially for exploratory data analysis.
Graph models are a promising complementary approach to the exploration of such
digital collections, by considering the data as a network of connected information
through nodes and edges. The edges represent relationships between the nodes and
their properties. By using graph models it is not only possible to apply network
analysis metrics and algorithms to investigate the characteristics of the given data
set. Furthermore, force-directed placement algorithms [
Fruchterman and Reingold 1991] allow generating visual layouts where highly
connected nodes are placed close together. Looking at these visualizations can help
theresearcher to spot hidden implicit structures such as ego-networks, cliques, and
central nodes which may point to historically relevant insights.
A number of universal tools are readily available and widely used for graph analysis
and visualization. Prominent examples include Gephi [
Bastian, Heymann, and Jacomy 2009], Cytoscape [
Shannon et al. 2003] and Palladio (
https://hdlab.stanford.edu/palladio). The advantage of these off-the-shelf
solutions lies in the fact that the graphs to be studied can be generated from any
data source, as they are imported via pre-formatted files. However, the spreadsheets
have to be structured and the considered data has to be limited in such a manner as
to answer certain predetermined research questions.
As an example, the user may be interested in the people cited in a set of documents
and sets up the graph of all persons linked to the documents they are mentioned in.
If a cluster of persons stands out for their high number of coappearances, the user
may want to understand their family relationships, or learn more about the network of
organizations and events they are connected to. However each follow-up graph requires
exporting specific data from the database, and preparing and importing further
spreadsheets. The resulting workflow is rather clumsy and not appropriate for
exploratory studies with open questions. Moreover, when dealing with evolving data
collections which are at times enriched or corrected, as is also the case with
Romans1by1, it is more advisable to work with visualisations directly extracted from
the original database and not via exported files that may become obsolete.
Therefore, to keep the workflow swift and the visualisations up-to-date, the DH
community started turning in the last years to the use of graph databases, i.e.
dedicated database solutions where the information is from the outset inherently
stored in the form of a graph. These solutions also typically come with built-in
tools allowing the user to inspect their dataset in an interactive way via queries
and straightforward visualizations. The next section discusses the conceptual key
differences between traditional relational and graph databases, and presents several
projects where a graph database have already been successfully applied.
III. Relational databases vs. Graph databases
Relational databases, simply defined as databases structured to save and recognize
relationships between stored items, are extensively used in all scientific,
industrial and commercial domains, and they continue as such to this day because of
their efficient and non-redundant data storage and manipulation [
Rob and Coronel 2000]. The relational database model organizes data into one
or more tables of columns and rows, with a unique key identifying each row, called a
primary key. The tabular structure is a good choice for many list like
business-related records such as accounting or customer data management. However,
relationships between data elements are often poorly represented in such databases.
They have to be computed at query time by matching primary and foreign keys of all
rows in the connected tables. These operations have exponential costs in calculus and
memory footprint, so that relational databases tend to struggle with computing
relationships efficiently [
Kleppmann 2017]. Moreover, the rigid schemas
of tabular data models makes it difficult to add new or different kinds of
relationships.
On the other hand, graph databases use particular graph-oriented data models with the
concept of nodes and edges to store connections directly alongside the data. Nodes
are the entities in the graph. They can hold any number of properties in the form of
key-value pairs. Edges represent directed and named relationships between two nodes.
Like nodes, edges can also have properties. In most cases, these are quantitative
properties, such as weights, costs, or distances. It is important to understand that
a graph data model cannot capture fundamentally new information compared to a
relational data model. The key difference lies in the way data is organized and
accessed. Where relational databases use indexing through unique keys to model
relationships, graph databases, on the other hand, store edges through pointers
allowing to rapidly find the neighbours of a node. Graph databases are therefore an
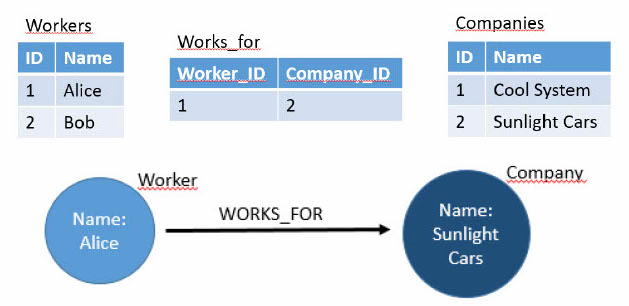
efficient solution when dealing with volumes of highly connected data. As an example,
the following relational table-based and graph based data models implement the same
schema:
Although two isolated connected nodes look like a triple of the form
“subject-verb-object”, note that a graph-based dataset is not organized in
triples. Each node has a unique instance in the database and can be connected to many
other nodes.
A number of well-established graph databases is readily available, such as Neo4j
(
https://neo4j.com), ArangoDB (
https://www.arangodb.com), DGraph (
https://dgraph.io) and OrientDB (
https://orientdb.org). Existing relational
databases of digital historical collections have been imported or converted,
partially or entirely, into such databases. A typical example is the project
Regesta Imperii (
http://www.regesta-imperii.de/regesten/suche.html), a vast collection of
charters documenting the activities of Roman-German kings and emperors, as well as of
the popes from the Middle Ages. Parts of this collection, divided into subcollections
containing charters issued by a given emperor, have been transferred to graph
databasesThe resulting visualizations allow for much easier comprehension of the
connections between the appearing entities such as persons, places, actions, dates
and events ([
Kuczera 2017]; [
Kuczera 2019]).
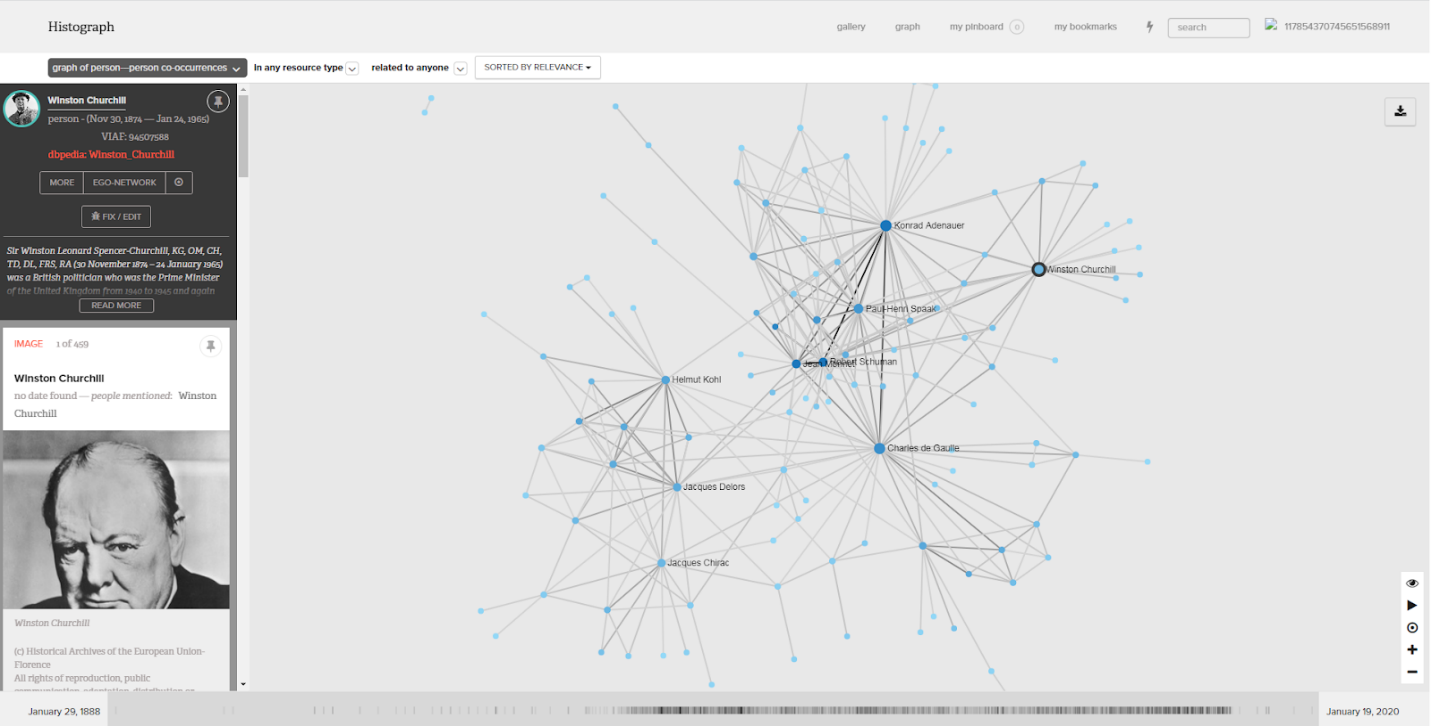
The histoGraph project has been conducted at the Centre Virtuel de la Connaissance
sur l’Europe (CVCE), a former research and documentation center that in 2016 was
integrated into the University of Luxembourg. The project aimed at designing tools
for exploratory investigation and analysis of an existing historical multimedia
collection compiled by the CVCE (
https://www.cvce.eu/epublications). The documents were processed via named
entity recognition, and the links between the documents and the detected entities
were stored in a graph database. As a key functionality, histoGraph implements an
interactive graph visualization revealing co-occurrences of persons or locations in
the collection ([
Novak et al. 2014]; [
Guido et al. 2016]).
A subset of the histograph dataset was reused in the BLIZAAR project whose objective
was the design of innovative prototypes for the exploration of complex graph
scenarios. Among other results, the interactive visualization platform Intergraph
[
Bornhofen and During 2020] has been implemented and connected to the
database. Intergraph offers a way to navigate through the data especially for users
having no or very limited experience with database manipulation and graph theory.
The above projects feature large and complex datasets with multiple types of
connected entities (Persons, Places, Organizations, Things, Events, Dates, Actions,
etc.). The Romans1by1 database stands out for its simplicity and allows showcasing
the migration from relational to graph databases through a straightforward model
procedure which can be readily adapted to many other uncomplicated historical
datasets.
IV. Romans 1by1 – from Relational to Graph database
Most large datasets of ancient names or persons are not prosopographies in the
technical sense, but corpora (defined as a collection of recorded
utterances used as a basis for analysis). Nonetheless, some of them must be
quoted for their role in the development of prosopographic research. So are Prosopographia Imperii Romani (PIR), Prosopography of the Byzantine World (PBW), and Hellenistic Babylonia: Texts, Images, Names (HBTIN), which tend to focus
on specific and delimited time and place, and social class or categories of person.
Equally valuable however, is the Lexicon of Greek Personal
Names (LGPN), which does not gather the biographical data and other
information typical of a prosopography, but identifies individuals and core
information about them, including relationships with others. While these
corpora were paper-born, they have currently migrated to the digital
environment. This phenomenon, the emergence of digital humanities in various forms,
changes the shape of and perception on the non-elites prosopography for
Antiquity.
In the digital era, building prosopographies for the ancient world is very much
tributary to the model suggested by John Bradley and his research group at King’s
College London, which marked the shift from narrative descriptions to information on
persons as structured data (
https://www.kcl.ac.uk/factoid-prosopography). Working mainly on the
Prosopography of Anglo-Saxon England (PASE), Bradley
theorized the concept of prosopographical “factoids” – small pieces of data
about persons (name variants, occupations, places of residence, events in which they
played a role, personal and professional relationships, possessions, etc.) provided
by the sources, which are not exactly facts as we cannot verify their veracity ([
Bradley 2005]; [
Bradley and Short 2005]). Factoid
prosopographers took these pieces of information and registered them into a
relational database that reflected their connections and relationships. One of the
main advantages of this model lies in the fact that it offers the opportunity to stay
true to the source – a necessity when we are sometimes dealing with inconsistent or
even antagonistic sources.
Romans1by1 has been documented before ([
Varga 2017a, 333–341], and
far more detailed, [
Varga 2017b, 44–59]), thus we will only
schematically present its architecture and the metadata. No doubt, one of the most
important features is the creation of a born-digital prosopographical
corpus, constantly updated. Another advantage is given by the fact
that the database was built in order to be very user-friendly and adaptable to the
research question one has; more precisely, we speak of the search filters in each
main category which allow the user to request a specific set of information from the
database. In this manner, at a click distance, we can find, for example, who all
members of private associations were, or who the attested governors of the provinces
were. Moreover, all the information of our choice can be easily downloaded in an
excel file and scientifically processed later on.
Technically speaking, Romans 1by1 is a relational database, built in MySQL and
following the best practice models for population databases [
Mandemakers and Dillon 2004]. The metadata is structured into four major
tables (
Inscriptions,
Bibliography,
Personal Data and
Personal relationships – summing up to more than 100
separate attributes).
The first table to be filled in is the file of the source –
Inscriptions. To begin with, each inscription gets an identification
code, formed of 5 digits and an acronym of the province’s name (D for Dacia, MS for
Moesia Superior, MI for Moesia Inferior) – so we have, for example 00001MS. In this
section, certain fields are linked to other existing resources, in order to obtain
maximum efficiency for the users. The texts of the inscriptions are linked to the
Epigraphische Datenbank Heidelberg (
http://edh-www.adw.uni-heidelberg.de/home), Clauss-Slaby (
http://www.manfredclauss.de/) and/or
Packhum (
https://epigraphy.packhum.org/) databases, while the places have been
referenced to Pleiades (
https://pleiades.stoa.org/) or Trismegistos (
http://www.trismegistos.org/). The
Bibliography section was conceived in a way so that
extracting complete or selective bibliographical lists would be possible. Thus, a
normalization table includes all bibliographical titles referred to and being quoted;
with the help of a value list, one can choose one
Bibliography
abbreviation for which the full reference, detailed information and
comments are then displayed. Of course, all data are linked to the
Inscription code, selected as well from a value list.
The core of the database is a table used for recording data about individual persons
(labelled
Personal data), around which the entire
network of relations is built. Each new entry represents a singular epigraphic
attestation of an individual, and a unique ID is generated, which will help link the
character within the various components of the database and with other database
entries. The person is also manually linked to the source using a value list of the
inscriptions` codes. In the case of one person being attested by multiple epigraphic
sources, each attestation will be represented by a new entry, to which a new unique
ID will be assigned and which will be doubled during linkage procedures by a common
ID for all instances of the same person. Expectedly, this metadata is the most
volatile one, being in a continuous process of modification and enlargement. As a
principle, we are trying to remain faithful to the source and to record during the
first phase only the minimum of deduced information. The first section of fields from
this table includes personal identification information on the person:
Praenomen,
Nomen,
Cognomen/Personal name,
Father/Master name,
Agnomen,
Signum,
Natione,
Ethnicity,
Origo,
Domus, Local citizenship, Gender, Juridical status,
Occupation,
Deities,
Age (at death),
Details of life/death and
Observations. For
Collegium/Association and
Religious
position we opted for check boxes, which open a series of fields. For the
associative forms we have three free text boxes:
Type of
association,
Position within the association,
Activities within the association, which allow for
certain flexibility and the possibility to accommodate information and realities from
both Roman and Greek inscriptions. In the case of
Religious
position, the situation is a bit more complex: when checking this option,
a drop down list of
Sacerdotal office opens whose values
are (at the moment)
Augur,
Flamen and
Pontifex and a series of further check-boxes:
Coloniae / Municipii
sacerdos,
Military sacerdos,
Imperial priest,
Divinity priest,
Laurentium Lavinatium. All of them, with the
exception of the last one, open a
Details text field for
description ([
Varga 2017b, 48–49]).
The second half of the Personal information table is
dedicated to political and social status. This part of the metadata consists of a
series of checkboxes, each opening different categories of specialized attributes:
Ordo senatorius, Ordo
equester, Provincial Governor,
Procurator, Local
magistrate, Decurionate. The next information
items cover Imperial slave, Imperial freedman and the
Military personnel, all equipped with Details attributes.
Based on the personal ID given to each individual, the
Relationship table will solely name the relationship between individuals
(A to B and B to A) ([
Varga 2017b, 50]), choosing from a drop-down
menu. The relationship values have been encoded and we have tried to adjust the
concepts to the SnapDrgn ontology (
https://snapdrgn.net/ontology).
Very important for us was the search interface of the database. Built with
Ruby-on-rails, it was designed to respond to the most manifold and complex search
options. Every component of the database has search filters for every particular
field, as well as a general search.
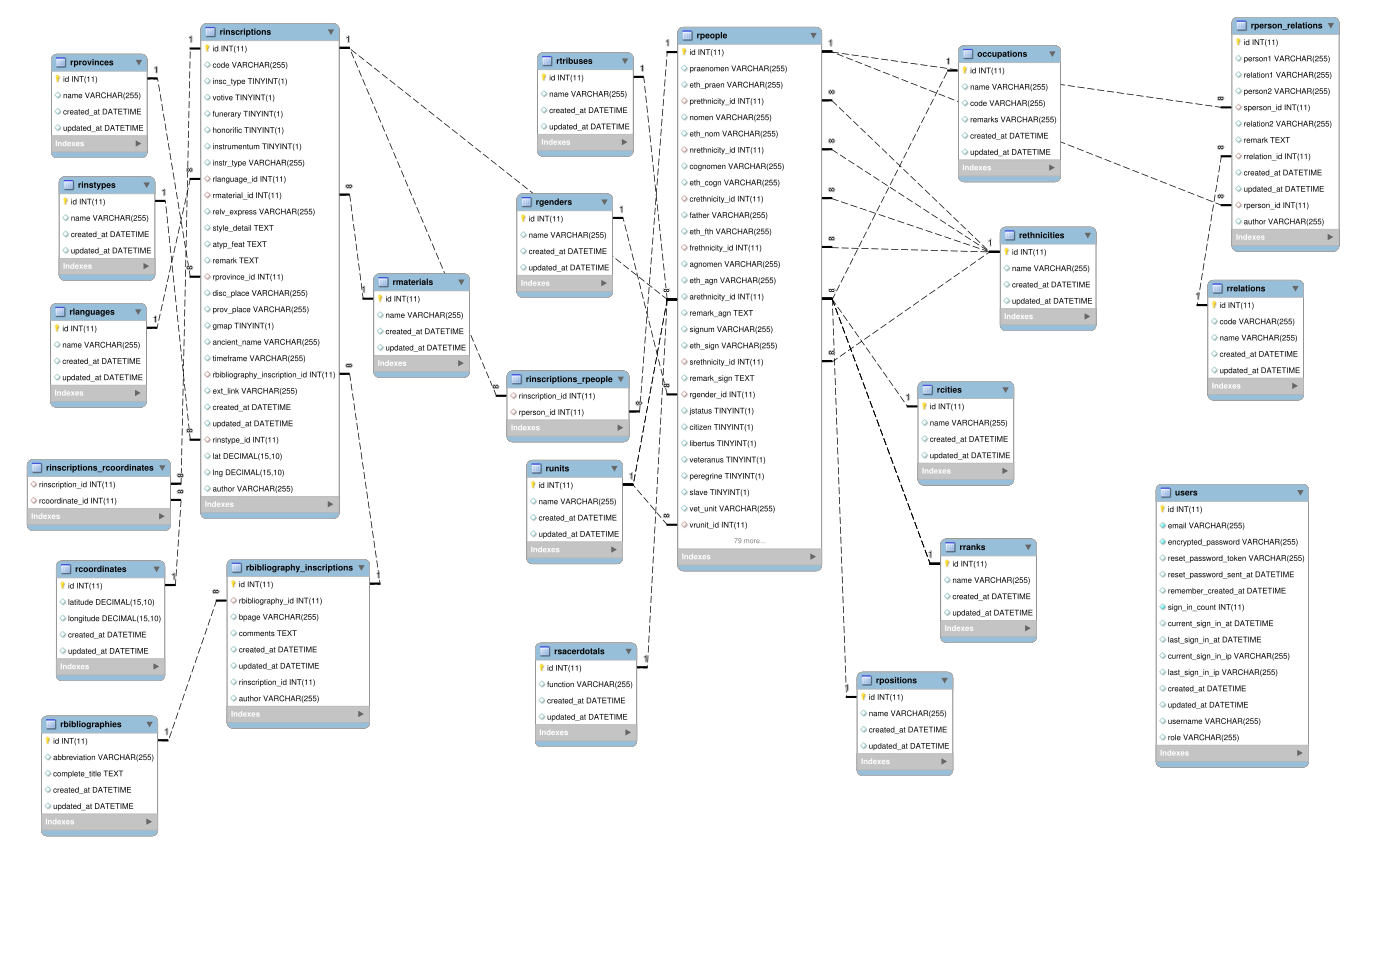
Even though the schema seems complex due to the multitude of tables and fields, it is
in fact straightforward. The main tables are the People (rpeople) and Inscriptions
(rinscriptions), which are directly related, as people are attested solely and
exclusively in inscriptions. Another possible relationship is between people,
attested in the same sources. Based on these, the design of the corresponding graph
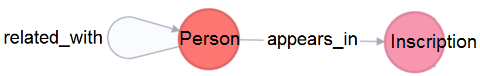
data model has been easy to conceptualize:
- Persons and Inscriptions are graph nodes. Five Person types have been defined
according to their province: Dacia, MoesiaInf, MoesiaSup, PannoniaSup,
Dalmatia.
- Person-Person relationships and appearances of a Persons in an Inscription are
graph edges. The related_with relationship between
two persons can be miscellaneous such as HusbandOf, FatherOf, WifeOf, SlaveOf,
etc.
We selected the Neo4j database for the Romans1by1 use case because Neo4j:
- Is an open-source native graph database publicly available since 2007
- Features Cypher, a declarative query language similar to SQL, but optimized for
graphs
- Offers built-in tools for manipulating and visualizing data, such as the Neo4j
Browser for developers and Neo4j Bloom for analysts
- Is used by companies and organizations in almost all industries
- Has an active graph community and sound documentation surrounding the
technology
- Is free to use under the GPLv3 licence for non-commercial use cases (Neo4j
Community Edition)
- Neo4j has been successfully used in other academic research projects ([Guido et al. 2016], [Kuczera 2017]).
The technical procedure for the data transfer of the relational to the graph database
is the following:
- In MySQL, export the tables from the relational database in csv formatted
files
- In Neo4j, write import scripts in Cypher language which read the csv files and
create appropriate graph elements
- a. Create a node for each entry in the tables Person and Inscription. All
table fields become node properties.
- b. Create an edge for each entry in the many-many relationship tables
appears_in and related_with.
When applying a graph model to ancient epigraphic sources, as it is the case of
Romans1by1, we have to take into consideration two main factors: the texts are not
standardized in any form, the details they offer being altogether subjective and the
information is generally scarce. Nonetheless, a graph database brings forth the
possibility to visualize connections in a direct manner, which can constitute an
important advantage, especially for people who get in contact with the information
for the first time such as students or researchers unfamiliar with the area.
At this point, the main outcomes of our research can be divided in three general
categories: source-connected, network-connected and diachronic distribution graphs.
The relation of a given person to the sources and how he/she is represented in
various texts is highly important, especially in the prosopography of Greek and Roman
non-elite characters. Going a step further than the factoid model, we textualize
individuals and individualize texts, meaning that the inscription itself - and the
“factoids” it narrates - become part of the individual’s ego-history
[2]
Thus, the link between individual and source is rendered as more important than
initially imagined by traditional historiography. The network analyses refer to
individual networks, but it also allows researchers to compare and superpose two (or
more) persons’ networks, as well as to visualize and investigate “immaterial”
networks, connections between institutions, economic actors, etc. The diachronic
distribution graphs show quantitative and qualitative changes that occur over time at
the scale of epigraphic habits, network patterns and individual movement, in a
certain region or micro-region. Correlating all these types of information and
visualizing them comes with great analytic gains, as it reveals a more complex
picture of the people we study and the fabric of their society.
V. Case studies and preliminary results
Working on a virtually exhaustive repository, such as Romans1by1 is, gives one
the opportunity to undertake macro-analyses, to dwell not only in the prosopographic
data offered by a certain province but also to place these data in a wider context
and get to relevant conclusions. The possibility to compare between provinces is also
a huge gain, creating context and offering answers to questions that do not even
reveal themselves otherwise.
What additions do we get from transposing the database into a graph
format? Mainly, we get an extra degree of clarity, the possibility of bird eye
visualizations of the people and the sources attesting them, as well as the
possibility to identify more connections and relationships than a flatter,
table-structured model would allow. All these allow us to reconstruct networks and
undertake prosopographic analyses with more insight and relevance.
For this section, we have selected a series of case studies to demonstrate how
ingestion of information into a graph database model and their subsequent analysis
from a historian’s perspective can improve our knowledge and understanding of ancient
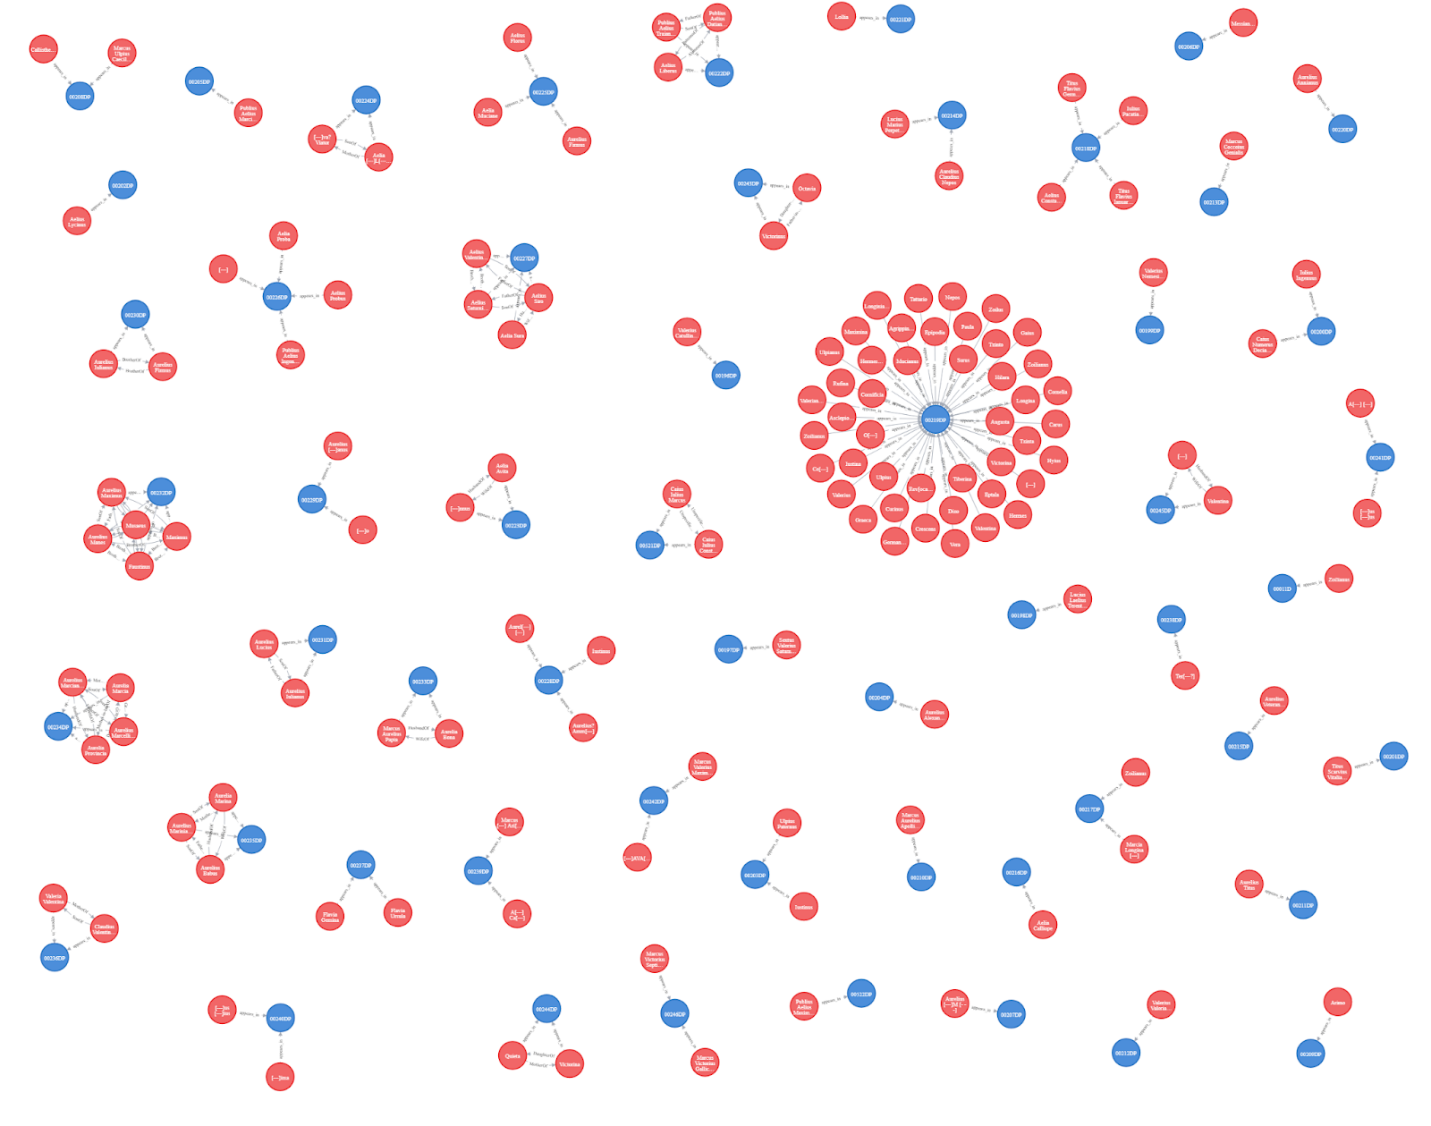
society. The first example is a selection of
all people attested in a
certain settlement - in our case Napoca, from Roman Dacia. In the graph
below, the red nodes are our central entities, namely the attested people and the
blue ones are the sources. Thus, here we can see not only the number of attested
people but also the connection between them, as well as between them and the sources.
Napoca was the first urban settlement of northern Dacia, became a
municipium under Hadrian and a
colonia during Marcus Aurelius’ reign ([
Ardevan 1998, 61–65]; [
Voișian et al. 2000]; [
Diaconescu 2004, 117–121]). As the administrative center of Dacia Porolissensis, it became
the capital of the province and the seat of the
procuratores, both praesidial (118/119-168) and financial (after 168).
On the graphic representation, we have the chance to visualize the approx. 130 people
of Napoca, their individual networks and pinpoint collective sources, which attest a
multitude of persons implicitly connected. What is most striking at a first sight is
an inscription attesting multiple people, thus creating a network. We are dealing
with the list of members of the
spira Asianorum (CIL
III 870) from 235, a local association reuniting people from the province of Asia. We
know that the association, besides its social and religious role, was also involved
in commerce. Unfortunately, no other member of the
spira is attested by a different inscription as well and the network
remains circular. Nonetheless, it tells us something about epigraphic habits: the
source attesting a network is an association list, a document typical rather to Greek
epigraphy; Latin commemoration or adulation habits imply rather small, often familial
groups.
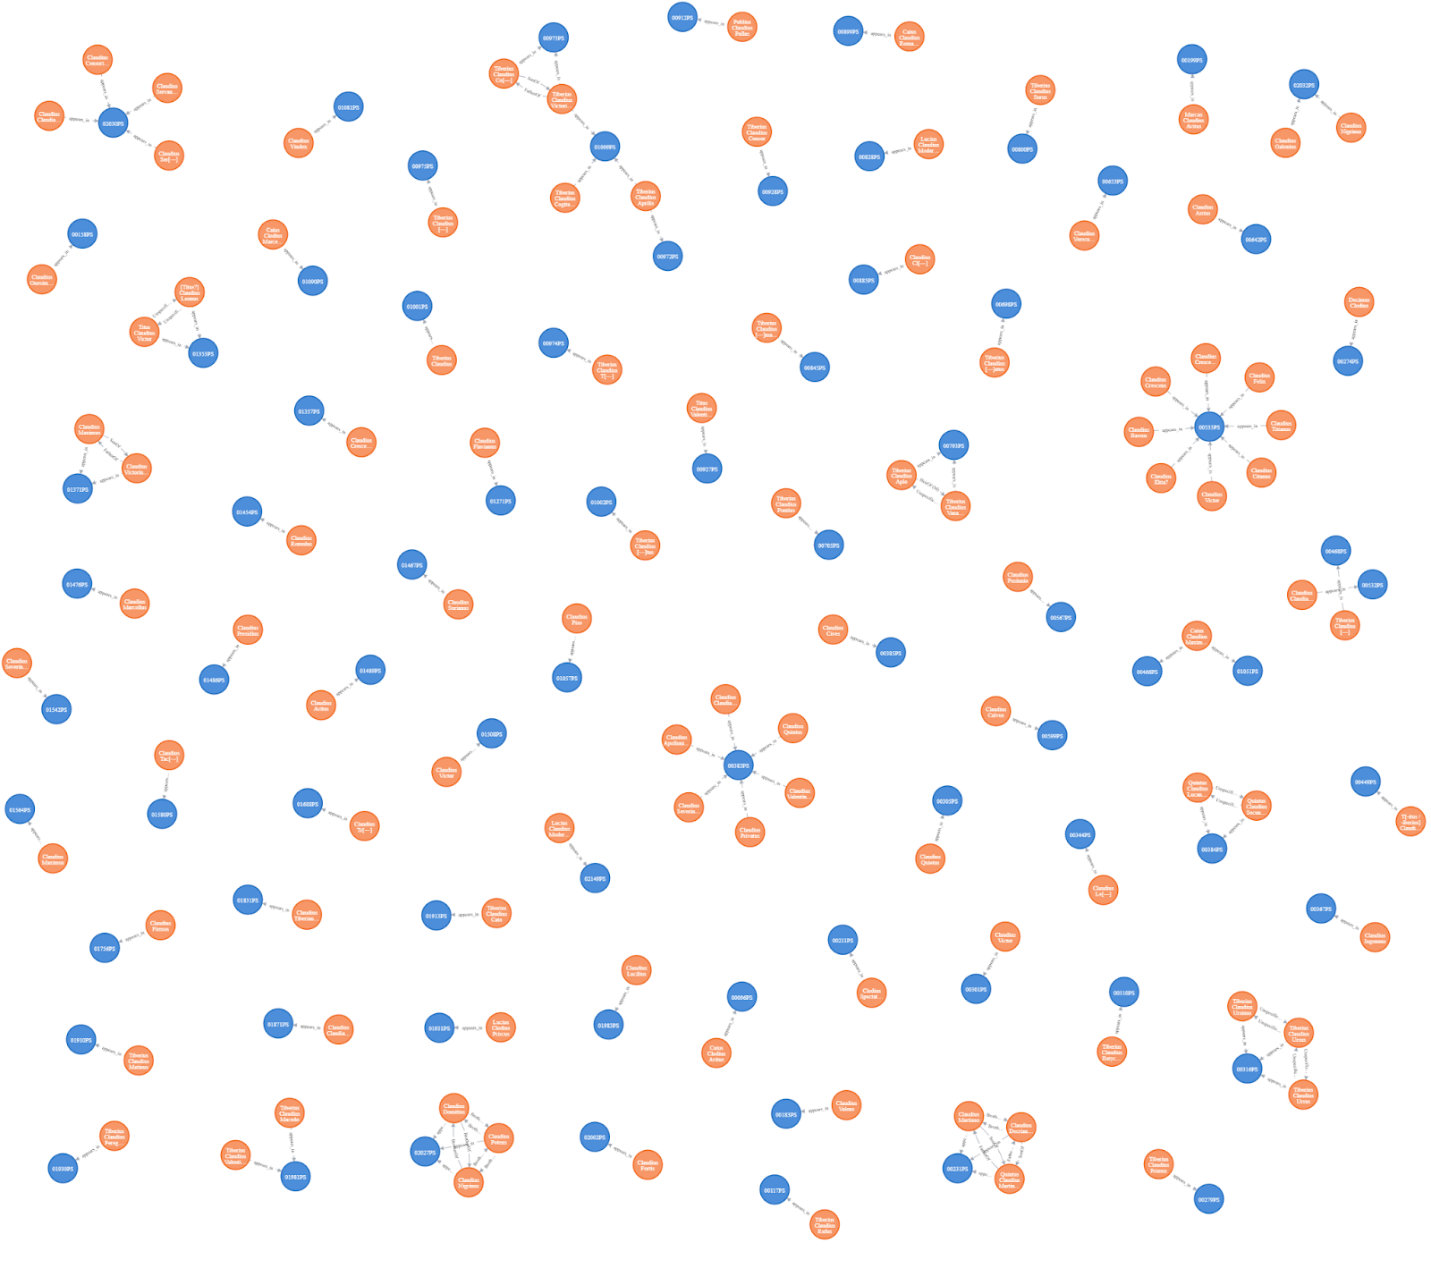
Another possible case study of historical population is focused on onomastics.
Namely, we have concentrated on the people bearing a certain name, in a certain area.
The graph below lists all people bearing the nomen Claudius/Clodius in Pannonia
Superior. Here the interesting historical facts to take into account are,
besides the number of name bearers in itself, the possibility to see relations and to
observe if more members of the same family/group bear this nomen. In this case, we again mostly see small networks, but what
strikes us in a few cases is the lack of explicit relationship between persons. For
example, in one instance (CIL III 4244) we have two soldiers, named Tiberius Calusius
Aplo and Tiberius Claudius Vanamius. The text explicates only the fact that Aplo is
the heir of the deceased Vanamius, without revealing other potential relationship.
Nonetheless, seeing them on an onomastic graph, the name similitude is much more
obvious the possibility that the two were actually close relatives.
In the case of the previous two examples, migrating from table-form to graph has a
number of important and relevant aspects: first, we are able to see at a glance the
entirety of people and adjacent sources (inscriptions). Then, we have a clear and
immediate vision of the connections: in both cases we can easily observe that almost
none of the characters is attested by more than one source. This ascribes the
networks to very limited circumstances. Nonetheless, we do have a notable exception,
in the person of Tiberius Claudius Victorinus (AE 1998, 1049; AE 2003, 1353),
attested by two monuments. The man was a decurion of Savaria and we get to know him
and his family from his son’s epitaph and from his own funerary monument. So, we have
the representation of an elite family that doesn’t go beyond first degree blood
connections. Even so, it is interesting to note that he outlived his son, as well
that they preferred separate monuments (maybe connected to separate burial locations)
instead of a larger family monument.
As well, in both cases we see that we have a couple of major sources, attesting a
multitude of people - more poignant in the first case, as we have the list of an
association’s members from Napoca. All these features strike us as obvious on a graph
representation and give us an overview of the epigraphic situation.
Slightly different is the construction of personal networks. In this case, the
research questions asked and answered are of a different nature.
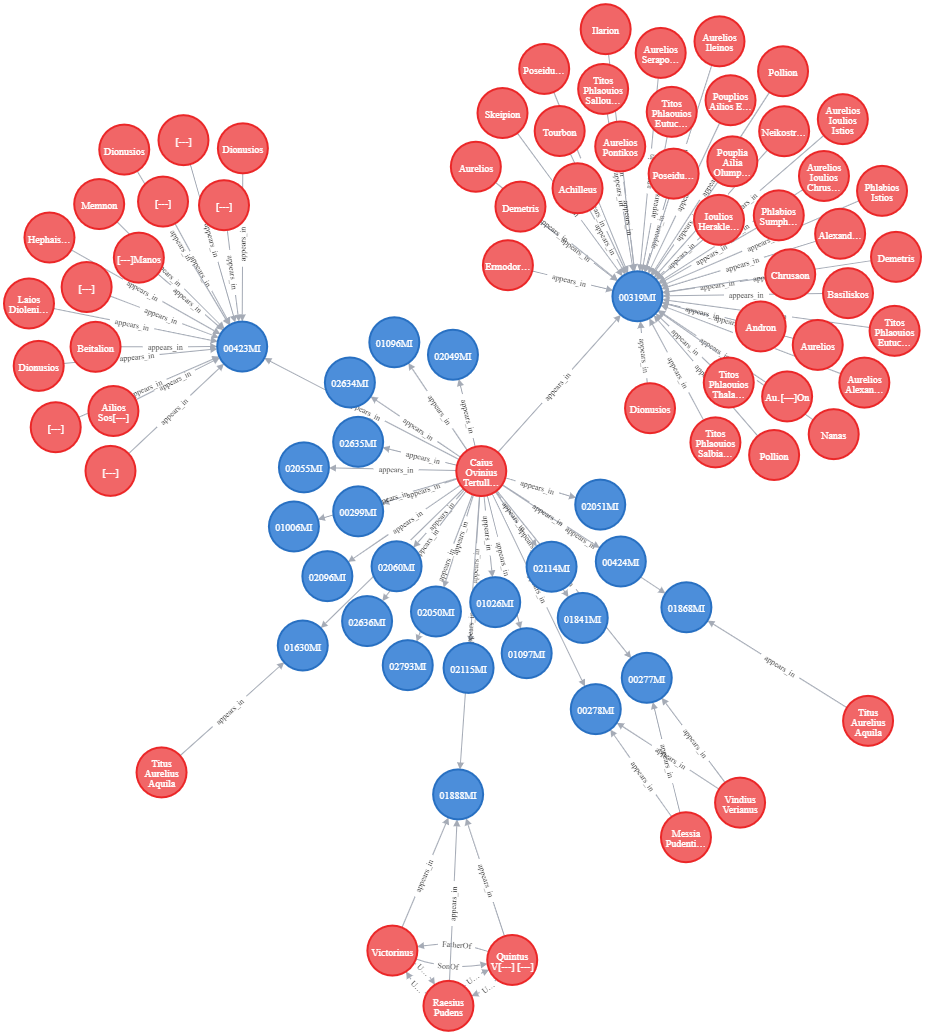
The first network we are showcasing is that of Caius Ovinius
Tertullus, governor of Moesia Inferior in 198-201. What’s remarkable in this
case is the fact that the many attestations don’t bring forth a proportionate
quantity of human connections. Most attestations come from official monuments,
milliaria, and dedications made by the governor
alone. Only few inscriptions place him in a social context: the dedication for the
emperors’ health made by a religious association (ISM II 82), or dedications made for
his own health by members of his staff and other minor officials (as it is the case
of Raesius Pudens, a primiscrinius officina - CIL
III 12370). So, what we get in this case is an important man, a local official, who
doesn’t necessarily manifest himself epigraphically at a personal level, doesn’t
dedicate to private deities and doesn’t associate family members to his acts, but is
very present in the organization of the roads system from the province, as well as in
the urban landscape building.
The last account focuses on the story of a relocation, of a merchant who leaves Dacia
to live in Dalmatia, but retains links with his home province, around the year
200.
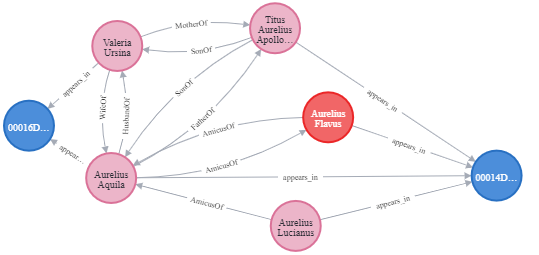
Aurelius Aquila's network brings to the fore several topics of
discussion. We know Aquila from an inscription discovered at Solin (ancient Salona,
province of Dalmatia, in today's Croatia) and we learn that he was a merchant from
the province of Dacia, former decurion of Potaissa. The inscription was placed on the
front of a sarcophagus. The text of the inscription reveals the person buried in the
sarcophagus: Valeria Ursina, daughter of Titus and wife of Aurelius Aquila. The
husband, who dedicates the monument, tells us that the deceased was an "incomparable"
wife and that they lived together for seven years without a single quarrel (CIL III
2086). The sarcophagus, simple as it may have been as an accomplishment, denotes the
status of the family in society, as obviously not everyone could afford such a
monument.
Aquila, however, is also known to us from an inscription from Split (Spalatum, near
Salona). The two monuments have not been associated until recently [
Varga 2016], and it was not known that we could reconstruct more of this
person's life from them. This second monument is also funerary, but this time a stela
- a gravestone. Here Aquila is in the role of 'most unfortunate father', as he was
burying his son, Titus Aurelius Apollonius, who died at the age of 33 at Sirmium (in
Lower Pannonia, now Sremska Mitrovica in Serbia). The young man had followed a
military career, most likely as a centurion in a military cohort in Pannonia. But the
tomb is not only Aurelius Apollonius', Aquila also buried two friends here: Aurelius
Flavus, a Syrian merchant who died at 55, and Aurelius Lucianus. Of course, Flavus'
trade immediately brings to mind the other monument, to which we shall return.
An exact family reconstruction is impossible, and we have to wonder whether this son
of Aquila is also the son of Valerius Ursina, or of a later wife of the decurion
relocated to Dalmatia. There are, however, several clues suggesting that he is the
son of Valeria. First, the name: the surname Titus is also that of the deceased
wife's father. Then the age, 33 at the time of death, and the fact that the father
was still fit, indicate the child was born in Aquila's youth. And finally, the lack
of a mother to co-dedicate this funerary monument suggests her total absence from the
landscape, and thus the death prior to that of the son. At this point, we must
underline again the utility of a graph model, as the relationships, with or without a
certain degree of ambiguity, appear visible, “clean”, and accurately connected
to the sources, thus making interpretation easier and more to the point.
Returning to the other two deceased honoured by this monument: of Aurelius Lucianus
we know nothing else, as he is only attested here. Aurelius Flavus, however, appears
on another monument in the province of Dacia itself. In Dacia, at Apulum, our
character is attested with the same name and description as a merchant, Syrian by
origin, on a dedication to Jupiter Optimus Maximus Dolichenus. This dedication was
made together with another merchant, a Syrian as well, Aurelius Alexander.
Aurelius Aquila, as decurion in Potaissa, was a member of the city's small local
elite. It should be pointed out that Roman municipal elites were often actively
engaged in local production and consumer markets, in commercial activities, lived and
valued the same things as those who had a more or less similar economic position, but
played no political role. At some point in his life, most likely while he was still
quite young, our man moved to Dalmatia. We don't know his reasons, but they could be
varied, ranging from better business opportunities offered by the Dalmatian coast to
family reasons. We don't know if he came here married, or if he met Valeria Ursina in
his new province of residence, but it is certain that after a few years of marriage
the young woman died, leaving behind a son. The husband buries her with enough pomp
to mark the family's position in society, and after this point we don't know what
Aquila's life was like. We do know, however, that he remained in Salona and
maintained his business ties with Dacia. Some of these ties overlap with personal
ties of friendship. At one point, his and Valeria Ursina's son, a centurion in
Pannonia, dies at the age of just 33, in circumstances unknown to us. At this point
in his life we also find Aquila. But the Decurion honours not only the memory of his
son by erecting a monument, but also of two friends, one of whom, Aurelius Flavus, a
merchant from Dacia. Flavus, although he bears a very Latin name, is a Syrian
merchant with connections in Dacia and Dalmatia, as the funerary monument shows.
Aquila is in charge of the memory of these two friends, which leads us to believe
that he also inherited them, at least in part, probably as a result of shared
business and capital.
Aurelius Aquila's small family and social network gives us a glimpse of real life and
provides concrete details of the great mobility of merchants in the Roman Empire, as
well as how strong and enduring the bonds built between them could be.
VI. Concluding remarks
The research behind this paper is still a work in progress — unavoidably, as a
database such as Romans1by1 is a dynamic tool, constantly updated and clearly
software development is iterative and will expand and evolve over time. Nonetheless,
the selected case studies reflect the entirety of the scientific context, as known
today. Applying a graph based data model to Romans1by1 led to visualizing not only
the networks as defined in SNA, but also the entirety of people attested in a certain
area, or displaying certain common features.
As demonstrated, prosopographic researches for the ancient world have evolved greatly
during the last few decades. The leap from paper to digital, followed by the
implementation of the factoid model and its subsequent adapting to the needs of
various projects, all represented great opportunities for researchers of the ancient
world to gain new insight on their sources, as well as to present their results in a
more synthetic and comprehensive manner. And while the historiography of the Roman
Empire’s elites has been developing on a different level and scale since the 19th
century, the prosopography of the non-elites, of the Empire’s middle classes, is very
tributary to these recent developments. As the sources are scarce and practically
unconnected, any possibility to connect them, to reveal patterns and understand
social behaviours is a huge gain.
This last point is where our researches come, as while absolute novelty is hard to be
revealed when working on the same, known sources. What we managed to highlight are
particular social and epigraphic habits: the preponderance of small, family networks
in Napoca, the un-explicitated possible family relations from Pannonia Superior, a
magistrate’s active involvement in the province’s organization, but lack of personal
epigraphic manifestations, and finally a story of mobility, relocation and conserved
networks which offer us a look into the lives of merchants.
What our endeavour has proven is that new approaches take us a bit further into the
social life of the Roman Empire, highlighting certain factual realities, as well as
the possibilities the future holds for non-elite prosopography.
Works Cited
Ardevan 1998 Ardevan, R. (1998) Viața municipală în Dacia romană. Mirton, Timișoara.
Bastian, Heymann, and Jacomy 2009 Bastian, M.,
Heymann, S., and Jacomy, M. (2009) “Gephi: an open source
software for exploring and manipulating networks”. Proceedings of the Third
International AAAI Conference on Weblogs and Social Media.
Bornhofen and During 2020 Bornhofen, S. and
During, M. (2020) “Exploring dynamic multilayer graphs for
digital humanities.”
Applied Network Science 5, 54
Bradley 2005 Bradley, J. (2005) “Documents and Data: Modelling Materials for Humanities Research in XML and
Relational Databases.”
Literary and Linguistic Computing, 20.1 (2005):
133–51.
Bradley and Short 2005 Bradley, J. and Short,
H. “Texts into Databases: The Evolving Field of New-style
Prosopography.”
Literary and Linguistic Computing, 20.1 (2005), pp.
3–24.
Diaconescu 2004 Diaconescu, A. “The Towns of Roman Dacia. An overview of recent archaeological
research in Romania”. In W.S. Hanson, I.P. Haynes (eds.), Roman Dacia. The Making of a provincial society (Journal of Roman Archaeology Supplementary Series 56),
Portsmouth, Rhode Island (2004), pp. 87-142.
Fruchterman and Reingold 1991 Fruchterman, T.M.J., and Reingold, E. M. (1991) “Graph Drawing
by Force Directed Placement,”
Software: Practice and Experience, vol. 21(11), pp.
1129-1164.
Guido et al. 2016 Guido, D., Wieneke, L., and
Düring, M. (2016) “histograph — Graph-based exploration,
crowdsourced indexation.”
CVCE, Luxembourg
Keats-Rohan 2000 Keats-Rohan, K.S.B. (2000) “Prosopography and computing: a marriage made in heaven?”,
History and Computing, 12.1 , pp. 1-11.
Kleppmann 2017 Kleppmann, M. (2017) Designing Data-Intensive Applications. O’Reilly.
Kuczera 2017 Kuczera, A. (2017) “Graphentechnologien in den Digitalen Geisteswissenschaften”
ABI Technik, 37.3, pp. 179-196.
Kuczera 2019 Kuczera, A. (2019) “Die ‘Regesta Imperii’ im digitalen Zeitalter. Das Regest als Netzwerk von
Entitäten”
Das Mittelalter, vol. 24, no. 1, pp. 157-172.
Mandemakers and Dillon 2004 Mandemakers,
K. and Dillon, L. (2004) “Best Practices with Large Datasets on
Historical Populations”, Historical Methods: A Journal
of Quantitative and Interdisciplinary History 37.1: pp. 34-38.
Novak et al. 2014 Novak, J., Micheel, I.,
Melenhorst, M., Wieneke, L., During, M., Moron J. G., Pasini C., Tagliasacchi, M.,
and Fraternali, P. (2014)“HistoGraph - A visualization tool for
collaborative analysis of networks from historical social multimedia
collections,” in Proc. Int. Conf. Inf. Vis.,
pp. 241–250.
Rob and Coronel 2000 Rob, P. and Coronel, C.
(2000) Database Systems: Design, Implementation, and
Management. (4th Ed.). Cambridge: Thomson Course Technology.
Schwartz et al. 2022 Schwartz, D. L., Gibson,
N. P. and Torabi, K. (2022) “Modeling a Born-Digital Factoid
Prosopography using the TEI and Linked Data”, Journal
of the Text Encoding Initiative, pp. 1-35
Shannon et al. 2003 Shannon, P., Markiel, A.,
Ozier, O., Baliga, N. S., Wang, J. T., Ramage, D., Amin, N., Schwikowski, B., and
Ideker, T. (2003) “Cytoscape: a software environment for
integrated models of biomolecular interaction networks,”
Genome Research 13(11), pp. 2498-2504
Varga 2016 Varga, R. (2016) “Aurelius Aquila, negotiator ex provincia Dacia. A prosopographic
reconstruction”. In R. Ardevan, E. Beu-Dachin (eds.), Mensa rotunda epigraphica Napocensis, Cluj-Napoca, pp. 27-34.
Varga 2017a Varga, R. (2017) “Romans 1 by 1. Documenting a population database for the Roman world”. In
S. Orlandi, R. Santucci, P. M. Liuzzo, F. Mambrini (eds.), Digital and traditional epigraphy in context. Proceedings of the EAGLE
2016 international conference, Roma, pp. 333-341.
Varga 2017b Varga, R. (2017) “Romans1by1 v.1.1. New developments in the study of Roman population”,
Digital Classics Online, 3.2, pp. 44-50.
Varga et al. 2018 Varga, R., Pázsint, A., Boda,
I., and Deac, D. (2018) “Romans 1by1. Overview of a research
project”, Digital Classics Online, 4.2, pp.
37-63.
Voișian et al. 2000 Voișian, V., Bota, E., and
Ciongradi, C. (2000) “Betrachtungen uber die Romerstadt
Napoca”. In H. Ciugudean, V. Moga, (eds.) Army and
Urban Development in the Danubian Provinces of the Roman Empire, Alba
Iulia, pp. 261–276.